
13°C
09:22
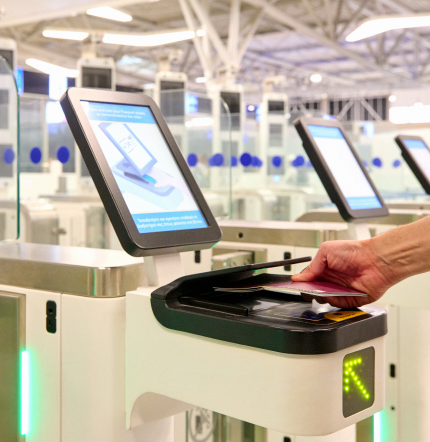
Get started with the essentials
Find all the essential information you need for a seamless, stress-free experience at Athens airport - from arrival to departure. Let us help make your journey smooth and enjoyable every step of the way.
Get assisted based on your needs
Essential information and practical tips for assisted travel, as well as traveling with children or pets, to ensure a seamless and comfortable journey.
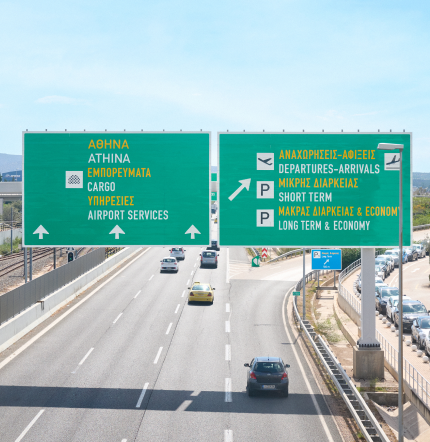
Transport to & from the airport by car
Transport by other means
Live the experience at Airport Agora


Feel the vibeof Athens city
Find all the inspiration and tips you need to conquer the city!


Explore more actions & synergies