Page 20 - 2board23full
P. 20
04. Financial Performance
Profitability Amidst a very adverse situation in the Greek economy,
AIA’s EBITDA, inclusive of AIA’s share from ADF reached Management’s efforts were directed towards
€249.1 million, compared to €278.4 million in 2010. sustaining solid revenue streams, optimising cost
Depreciation charges amounted to €72.5 million, slightly and investment and preserving the efficiency and
higher than the €72.2 recorded in 2010 and they are productivity achieved over the previous years, as
attributed to the start up of operations and depreciation these are depicted in the key performance indicators
of the photovoltaic park. Net financial expenses reached presented below.
€47.1 million, reflecting a €0.6 million positive variance
compared to the previous year, attributed to the reduction Table 4.2
of interest expense due to the lower outstanding balance
of Bank loans, partly offset by the lower interest earned 2011 vs. 2010 Key Performance Indicators
on cash. A PBT of €129.5 million was recorded, reflecting
a decline of €29.0 million compared to the previous year. Performance Indicators 2010 2011 change in
Corporate Taxation amounted to €25.5 million, reduced
by €36.4 million, due to the combination of three factors: Revenues & ADF / Pax (€)1 26.4 26.3 -0.4 %
the lower taxation by €6.5 million attributed to the Revenues & ADF / FTE ('000 €)2 567.6 533.1 -6.1 %
reduced PBT realised in 2011, €3.6 million derived from Revenues & ADF / Net Asset
the favourable impact of the reduction of corporate tax Value (%)3 38.1% 37.4% -0.7 pp
rate from 24% in 2010 to 20% in 2011, whereas the non Operating Cost / Pax (€) 8.3 9.0 8.7 %
application this year of the tax surcharge contributed PBT margin (%)4 pp
€26.3 million. Thus, the reduced corporate tax burden ROCE (%)5 39.0% 34.1% -4.9 pp
not only covered the drop in PBT of €29.0 million but AVA (million €)6 16.2% 14.1% -2.1
contributed to the realisation of a PAT of €104.0 million, 60.8 71.6
higher by €7.4 million in comparison to the previous year.
1 Net Turnover plus Subsidies / Passengers
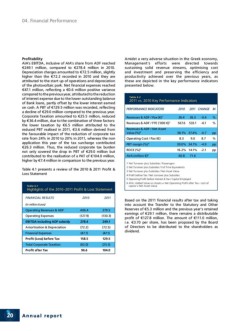
Table 4.1 presents a review of the 2010 & 2011 Profit & 2 Net Turnover plus Subsidies / Full Time Equivalents
Loss Statement 3 Net Turnover plus Subsidies / Net Asset Value
4 Profit before Tax / Net turnover plus Subsidies
Table 4.1 5 Operating Profit before Interest & Tax / Capital Employed
6 AVA: Added Value on Assets = Net Operating Profit after Tax - cost of
Highlights of the 2010–2011 Profit & Loss Statement
capital x Net Asset Value
Financial results 2010 2011 Based on the 2011 financial results after tax and taking
into account the Transfer to the Statutory and Other
(in million Euros) 406.4 379.5 Reserves of €5.3 million and the previous year’s retained
Operating Revenues & ADF (127.9) (130.3) earnings of €29.1 million, there remains a distributable
Operating Expenses 278.4 249.1 profit of €127.8 million. The amount of €111.0 million,
EBITDA including ADF subsidy (72.2) (72.5) i.e. €3.70 per share, has been proposed by the Board
Amortisation & Depreciation (47.7) (47.1) of Directors to be distributed to the shareholders as
Financial Expenses 158.5 129.5 dividend.
Profit (Loss) before Tax (62.0) (25.5)
Total Corporate Taxation 96.6 104.0
Profit after Tax
20 Annual report
Profitability Amidst a very adverse situation in the Greek economy,
AIA’s EBITDA, inclusive of AIA’s share from ADF reached Management’s efforts were directed towards
€249.1 million, compared to €278.4 million in 2010. sustaining solid revenue streams, optimising cost
Depreciation charges amounted to €72.5 million, slightly and investment and preserving the efficiency and
higher than the €72.2 recorded in 2010 and they are productivity achieved over the previous years, as
attributed to the start up of operations and depreciation these are depicted in the key performance indicators
of the photovoltaic park. Net financial expenses reached presented below.
€47.1 million, reflecting a €0.6 million positive variance
compared to the previous year, attributed to the reduction Table 4.2
of interest expense due to the lower outstanding balance
of Bank loans, partly offset by the lower interest earned 2011 vs. 2010 Key Performance Indicators
on cash. A PBT of €129.5 million was recorded, reflecting
a decline of €29.0 million compared to the previous year. Performance Indicators 2010 2011 change in
Corporate Taxation amounted to €25.5 million, reduced
by €36.4 million, due to the combination of three factors: Revenues & ADF / Pax (€)1 26.4 26.3 -0.4 %
the lower taxation by €6.5 million attributed to the Revenues & ADF / FTE ('000 €)2 567.6 533.1 -6.1 %
reduced PBT realised in 2011, €3.6 million derived from Revenues & ADF / Net Asset
the favourable impact of the reduction of corporate tax Value (%)3 38.1% 37.4% -0.7 pp
rate from 24% in 2010 to 20% in 2011, whereas the non Operating Cost / Pax (€) 8.3 9.0 8.7 %
application this year of the tax surcharge contributed PBT margin (%)4 pp
€26.3 million. Thus, the reduced corporate tax burden ROCE (%)5 39.0% 34.1% -4.9 pp
not only covered the drop in PBT of €29.0 million but AVA (million €)6 16.2% 14.1% -2.1
contributed to the realisation of a PAT of €104.0 million, 60.8 71.6
higher by €7.4 million in comparison to the previous year.
1 Net Turnover plus Subsidies / Passengers
Table 4.1 presents a review of the 2010 & 2011 Profit & 2 Net Turnover plus Subsidies / Full Time Equivalents
Loss Statement 3 Net Turnover plus Subsidies / Net Asset Value
4 Profit before Tax / Net turnover plus Subsidies
Table 4.1 5 Operating Profit before Interest & Tax / Capital Employed
6 AVA: Added Value on Assets = Net Operating Profit after Tax - cost of
Highlights of the 2010–2011 Profit & Loss Statement
capital x Net Asset Value
Financial results 2010 2011 Based on the 2011 financial results after tax and taking
into account the Transfer to the Statutory and Other
(in million Euros) 406.4 379.5 Reserves of €5.3 million and the previous year’s retained
Operating Revenues & ADF (127.9) (130.3) earnings of €29.1 million, there remains a distributable
Operating Expenses 278.4 249.1 profit of €127.8 million. The amount of €111.0 million,
EBITDA including ADF subsidy (72.2) (72.5) i.e. €3.70 per share, has been proposed by the Board
Amortisation & Depreciation (47.7) (47.1) of Directors to be distributed to the shareholders as
Financial Expenses 158.5 129.5 dividend.
Profit (Loss) before Tax (62.0) (25.5)
Total Corporate Taxation 96.6 104.0
Profit after Tax
20 Annual report