Page 19 - 2board23full
P. 19
2011
Aeronautical revenues, inclusive of AIA’s share from Operating Expenses
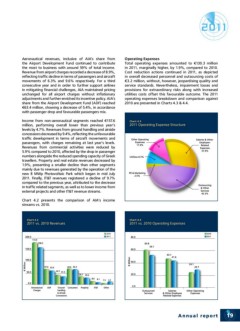
the Airport Development Fund continued to contribute Total operating expenses amounted to €130.3 million
the most to business with around 59% of total income. in 2011, marginally higher, by 1.9%, compared to 2010.
Revenue from airport charges recorded a decrease of 8.9%, Cost reduction actions continued in 2011, as depicted
reflecting traffic decline in terms of passengers and aircraft in overall decreased personnel and outsourcing costs of
movements of 6.3% and 9.6% respectively. For a third €3.2 million, without, however, jeopardising quality and
consecutive year and in order to further support airlines service standards. Nevertheless, impairment losses and
in mitigating financial challenges, AIA maintained pricing provisions for extraordinary risks along with increased
unchanged for all airport charges without inflationary utilities costs offset this favourable outcome. The 2011
adjustments and further enriched its incentive policy. AIA’s operating expenses breakdown and comparison against
share from the Airport Development Fund (ADF) reached 2010 are presented in Charts 4.3 & 4.4.
€63.4 million, showing a decrease of 5.4%, in accordance
with passenger drop and favourable passengers mix. Chart 4.3
Income from non-aeronautical segments reached €157.6 2011 Operating Expense Structure
million, performing overall lower than previous year’s
levels by 4.7%. Revenues from ground handling and airside
concessions decreased by 9.4%, reflecting the unfavourable
traffic development in terms of aircraft movements and
passengers, with charges remaining at last year’s levels.
Revenues from commercial activities were reduced by
5.9% compared to 2010, affected by the drop in passenger
numbers alongside the reduced spending capacity of Greek
travellers. Property and real estate revenues decreased by
1.9%, presenting a smaller decline than other segments
mainly due to revenues generated by the operation of the
new 8 MWp Photovoltaic Park which began in mid July
2011. Finally, IT&T revenues registered a decline of 9.7%
compared to the previous year, attributed to the decrease
in traffic related segments, as well as to lower income from
external projects and other IT&T revenue streams.
Chart 4.2 presents the comparison of AIA’s income
streams vs. 2010.
Chart 4.2 Chart 4.4
2011 vs. 2010 Revenues 2011 vs. 2010 Operating Expenses
Annual report 19
Aeronautical revenues, inclusive of AIA’s share from Operating Expenses
the Airport Development Fund continued to contribute Total operating expenses amounted to €130.3 million
the most to business with around 59% of total income. in 2011, marginally higher, by 1.9%, compared to 2010.
Revenue from airport charges recorded a decrease of 8.9%, Cost reduction actions continued in 2011, as depicted
reflecting traffic decline in terms of passengers and aircraft in overall decreased personnel and outsourcing costs of
movements of 6.3% and 9.6% respectively. For a third €3.2 million, without, however, jeopardising quality and
consecutive year and in order to further support airlines service standards. Nevertheless, impairment losses and
in mitigating financial challenges, AIA maintained pricing provisions for extraordinary risks along with increased
unchanged for all airport charges without inflationary utilities costs offset this favourable outcome. The 2011
adjustments and further enriched its incentive policy. AIA’s operating expenses breakdown and comparison against
share from the Airport Development Fund (ADF) reached 2010 are presented in Charts 4.3 & 4.4.
€63.4 million, showing a decrease of 5.4%, in accordance
with passenger drop and favourable passengers mix. Chart 4.3
Income from non-aeronautical segments reached €157.6 2011 Operating Expense Structure
million, performing overall lower than previous year’s
levels by 4.7%. Revenues from ground handling and airside
concessions decreased by 9.4%, reflecting the unfavourable
traffic development in terms of aircraft movements and
passengers, with charges remaining at last year’s levels.
Revenues from commercial activities were reduced by
5.9% compared to 2010, affected by the drop in passenger
numbers alongside the reduced spending capacity of Greek
travellers. Property and real estate revenues decreased by
1.9%, presenting a smaller decline than other segments
mainly due to revenues generated by the operation of the
new 8 MWp Photovoltaic Park which began in mid July
2011. Finally, IT&T revenues registered a decline of 9.7%
compared to the previous year, attributed to the decrease
in traffic related segments, as well as to lower income from
external projects and other IT&T revenue streams.
Chart 4.2 presents the comparison of AIA’s income
streams vs. 2010.
Chart 4.2 Chart 4.4
2011 vs. 2010 Revenues 2011 vs. 2010 Operating Expenses
Annual report 19