Page 23 - 2board23full
P. 23
Chart 5.2 2011
AVA per Business Unit Chart 5.3
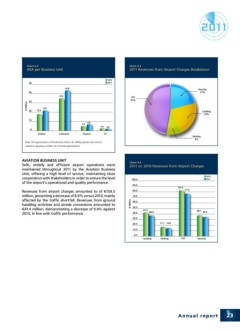
2011 Revenues from Airport Charges Breakdown
Note: The segmentation of the Business Units is for VBM purposes only and not Chart 5.4
related to regulatory Air/Non-Air Activities segmentation
2011 vs. 2010 Revenues from Airport Charges
AVIATION BUSINESS UNIT
Safe, orderly and efficient airport operations were
maintained throughout 2011 by the Aviation Business
Unit, offering a high level of service, maintaining close
cooperation with stakeholders in order to ensure the level
of the airport’s operational and quality performance.
Revenues from airport charges amounted to of €158.5
million, presenting a decrease of 8.9% versus 2010, mainly
affected by the traffic shortfall. Revenues from ground
handling activities and airside concessions amounted to
€41.4 million, demonstrating a decrease of 9.4% against
2010, in line with traffic performance.
Annual report 23
AVA per Business Unit Chart 5.3
2011 Revenues from Airport Charges Breakdown
Note: The segmentation of the Business Units is for VBM purposes only and not Chart 5.4
related to regulatory Air/Non-Air Activities segmentation
2011 vs. 2010 Revenues from Airport Charges
AVIATION BUSINESS UNIT
Safe, orderly and efficient airport operations were
maintained throughout 2011 by the Aviation Business
Unit, offering a high level of service, maintaining close
cooperation with stakeholders in order to ensure the level
of the airport’s operational and quality performance.
Revenues from airport charges amounted to of €158.5
million, presenting a decrease of 8.9% versus 2010, mainly
affected by the traffic shortfall. Revenues from ground
handling activities and airside concessions amounted to
€41.4 million, demonstrating a decrease of 9.4% against
2010, in line with traffic performance.
Annual report 23