Page 16 - 2board23full
P. 16
03. Market Overview 2011
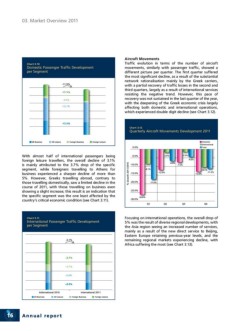
Chart 3.10 Aircraft Movements
Traffic evolution in terms of the number of aircraft
Domestic Passenger Traffic Development movements, similarly with passenger traffic, showed a
per Segment different picture per quarter. The first quarter suffered
the most significant decline, as a result of the substantial
network rationalisation mainly by the Greek carriers,
with a partial recovery of traffic losses in the second and
third quarters, largely as a result of international services
resisting the negative trend. However, this pace of
recovery was not sustained in the last quarter of the year,
with the deepening of the Greek economic crisis largely
affecting both domestic and international operations,
which experienced double digit decline (see Chart 3.12).
Chart 3.12
Quarterly Aircraft Movements Development 2011
With almost half of international passengers being
foreign leisure travellers, the overall decline of 3.1%
is mainly attributed to the 3.7% drop of the specific
segment, while foreigners travelling to Athens for
business experienced a sharper decline of more than
5%. However, Greeks travelling abroad, contrary to
those travelling domestically, saw a limited decline in the
course of 2011, with those travelling on business even
showing a slight increase; this result is an indication that
the specific segment was the one least affected by the
country’s critical economic condition (see Chart 3.11).
Chart 3.11 Focusing on international operations, the overall drop of
5% was the result of diverse regional developments, with
International Passenger Traffic Development the Asia region seeing an increased number of services,
per Segment mainly as a result of the new direct service to Beijing,
Eastern Europe retaining previous-year levels, and the
remaining regional markets experiencing decline, with
Africa suffering the most (see Chart 3.13).
16 Annual report