Page 13 - 2board23full
P. 13
2011
With respect to the airport’s aircraft movements, these Chart 3.3
amounted to 173 thousand during 2011, experiencing an
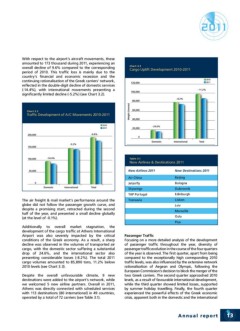
overall decline of 9.6% compared to the corresponding Cargo Uplift Development 2010-2011
period of 2010. This traffic loss is mainly due to the
country’s financial and economic recession and the
continuing rationalisation of the Greek carriers’ network,
reflected in the double-digit decline of domestic services
(-14.4%), with international movements presenting a
significantly limited decline (-5.2%) (see Chart 3.2).
Chart 3.2
Traffic Development of A/C Movements 2010-2011
Table 3.1
New Airlines & Destinations 2011
The air freight & mail market’s performance around the New Airlines 2011 New Destinations 2011
globe did not follow the passenger growth curve, and
despite a promising start, retracted during the second Air China Beijing
half of the year, and presented a small decline globally Jetairfly Bologna
(at the level of -0.1%). Skywings Dubrovnik
TAP Portugal Edinburgh
Additionally to overall market stagnation, the Transavia Lisbon
development of the cargo traffic at Athens International Lviv
Airport was also severely impacted by the critical Marseille
conditions of the Greek economy. As a result, a sharp Oslo
decline was observed in the volumes of transported air Pisa
cargo, with the domestic sector suffering a substantial
drop of 24.6%, and the international sector also Passenger Traffic
presenting considerable losses (-8.2%). The total 2011 Focusing on a more detailed analysis of the development
cargo volumes amounted to 85,890 tons, 11.2% below of passenger traffic throughout the year, diversity of
2010 levels (see Chart 3.3). passenger traffic evolution in the course of the four quarters
of the year is observed. The first quarter, apart from being
Despite the overall unfavourable climate, 9 new compared to the exceptionally high corresponding 2010
destinations were added to the airport’s network, while traffic levels, was also influenced by the extensive network
we welcomed 5 new airline partners. Overall in 2011, rationalisation of Aegean and Olympic, following the
Athens was directly connected with scheduled services European Commission’s decision to block the merger of the
with 113 destinations (80 international) in 49 countries, two Greek carriers. The second quarter approached 2010
operated by a total of 72 carriers (see Table 3.1). levels, as a result of favourable international development,
while the third quarter showed limited losses, supported
by summer holiday travelling. Finally, the fourth quarter
experienced the powerful effects of the Greek economic
crisis, apparent both in the domestic and the international
Annual report 13
With respect to the airport’s aircraft movements, these Chart 3.3
amounted to 173 thousand during 2011, experiencing an
overall decline of 9.6% compared to the corresponding Cargo Uplift Development 2010-2011
period of 2010. This traffic loss is mainly due to the
country’s financial and economic recession and the
continuing rationalisation of the Greek carriers’ network,
reflected in the double-digit decline of domestic services
(-14.4%), with international movements presenting a
significantly limited decline (-5.2%) (see Chart 3.2).
Chart 3.2
Traffic Development of A/C Movements 2010-2011
Table 3.1
New Airlines & Destinations 2011
The air freight & mail market’s performance around the New Airlines 2011 New Destinations 2011
globe did not follow the passenger growth curve, and
despite a promising start, retracted during the second Air China Beijing
half of the year, and presented a small decline globally Jetairfly Bologna
(at the level of -0.1%). Skywings Dubrovnik
TAP Portugal Edinburgh
Additionally to overall market stagnation, the Transavia Lisbon
development of the cargo traffic at Athens International Lviv
Airport was also severely impacted by the critical Marseille
conditions of the Greek economy. As a result, a sharp Oslo
decline was observed in the volumes of transported air Pisa
cargo, with the domestic sector suffering a substantial
drop of 24.6%, and the international sector also Passenger Traffic
presenting considerable losses (-8.2%). The total 2011 Focusing on a more detailed analysis of the development
cargo volumes amounted to 85,890 tons, 11.2% below of passenger traffic throughout the year, diversity of
2010 levels (see Chart 3.3). passenger traffic evolution in the course of the four quarters
of the year is observed. The first quarter, apart from being
Despite the overall unfavourable climate, 9 new compared to the exceptionally high corresponding 2010
destinations were added to the airport’s network, while traffic levels, was also influenced by the extensive network
we welcomed 5 new airline partners. Overall in 2011, rationalisation of Aegean and Olympic, following the
Athens was directly connected with scheduled services European Commission’s decision to block the merger of the
with 113 destinations (80 international) in 49 countries, two Greek carriers. The second quarter approached 2010
operated by a total of 72 carriers (see Table 3.1). levels, as a result of favourable international development,
while the third quarter showed limited losses, supported
by summer holiday travelling. Finally, the fourth quarter
experienced the powerful effects of the Greek economic
crisis, apparent both in the domestic and the international
Annual report 13