Page 15 - 2board23full
P. 15
2011
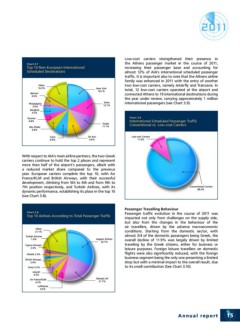
Chart 3.7 Low-cost carriers strengthened their presence in
the Athens passenger market in the course of 2011,
Top 10 Non-European International increasing their passenger base and accounting for
Scheduled Destinations almost 12% of AIA’s international scheduled passenger
traffic. It is important also to note that the Athens airline
family was enhanced in 2011 with the entry of another
two low-cost carriers, namely Jetairfly and Transavia. In
total, 12 low-cost carriers operated at the airport and
connected Athens to 19 international destinations during
the year under review, carrying approximately 1 million
international passengers (see Chart 3.9).
Chart 3.9
International Scheduled Passenger Traffic
Conventional vs. Low-cost Carriers
With respect to AIA’s main airline partners, the two Greek
carriers continue to hold the top 2 places and represent
more than half of the airport’s passengers, albeit with
a reduced market share compared to the previous
year. European carriers complete the top 10, with Air
France/KLM and British Airways, with their successful
development, climbing from 5th to 4th and from 9th to
7th position respectively, and Turkish Airlines, with its
dynamic performance, establishing its place in the top 10
(see Chart 3.8).
Chart 3.8 Passenger Travelling Behaviour
Passenger traffic evolution in the course of 2011 was
Top 10 Airlines According to Total Passenger Traffic impacted not only from challenges on the supply side,
but also from the changes in the behaviour of the
air travellers, driven by the adverse macroeconomic
conditions. Starting from the domestic sector, with
almost 3/4 of the domestic passengers being Greek, the
overall decline of 11.9% was largely driven by limited
traveling by the Greek citizens, either for business or
leisure purposes. Foreign leisure travellers on domestic
flights were also significantly reduced, with the foreign
business segment being the only one presenting a limited
drop but with a minimal impact to the overall result, due
to its small contribution (See Chart 3.10).
Annual report 15