Page 85 - Annual Report 2015 EN
P. 85
Annual Report 2015
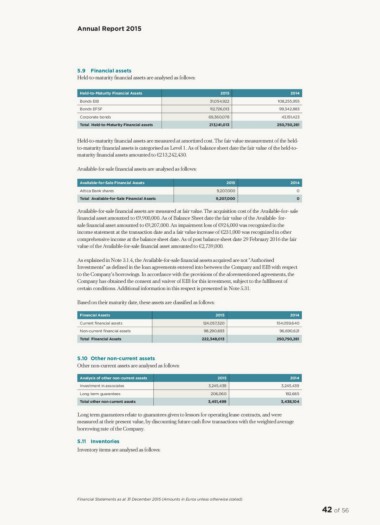
5.9 Financial assets
Held-to-maturity financial assets are analysed as follows:
Held-to-Maturity Financial Assets 2015 2014
Bonds EIB 31,054,922 108,255,955
Bonds EFSF 112,726,013 99,342,883
Corporate bonds 69,360,078
Total Held-to-Maturity Financial assets 213,141,013 43,151,423
250,750,261
Held-to-maturity financial assets are measured at amortized cost. The fair value measurement of the held-
to-maturity financial assets is categorised as Level 1. As of balance sheet date the fair value of the held-to-
maturity financial assets amounted to €213,242,430.
Available-for-sale financial assets are analysed as follows:
Available-for-Sale Financial Assets 2015 2014
Attica Bank shares 9,207,000 0
Total Available-for-Sale Financial Assets 9,207,000 0
Available-for-sale financial assets are measured at fair value. The acquisition cost of the Available-for- sale
financial asset amounted to €9,900,000. As of Balance Sheet date the fair value of the Available- for-
sale financial asset amounted to €9,207,000. An impairment loss of €924,000 was recognized in the
income statement at the transaction date and a fair value increase of €231,000 was recognized in other
comprehensive income at the balance sheet date. As of post balance sheet date 29 February 2016 the fair
value of the Available-for-sale financial asset amounted to €2,739,000.
As explained in Note 3.1.4, the Available-for-sale financial assets acquired are not “Authorised
Investments” as defined in the loan agreements entered into between the Company and EIB with respect
to the Company’s borrowings. In accordance with the provisions of the aforementioned agreements, the
Company has obtained the consent and waiver of EIB for this investment, subject to the fulfilment of
certain conditions. Additional information in this respect is presented in Note 5.31.
Based on their maturity date, these assets are classified as follows:
Financial Assets 2015 2014
Current nancial assets 124,057,320 154,059,640
Non-current nancial assets 98,290,693
Total Financial Assets 222,348,013 96,690,621
250,750,261
5.10 Other non-current assets
Other non-current assets are analysed as follows:
Analysis of other non-current assets 2015 2014
Investment in associates 3,245,439 3,245,439
Long term guarantees
Total other non current assets 206,060 192,665
3,451,499 3,438,104
Long term guarantees relate to guarantees given to lessors for operating lease contracts, and were
measured at their present value, by discounting future cash flow transactions with the weighted average
borrowing rate of the Company.
5.11 Inventories
Inventory items are analysed as follows:
Financial Statements as at 31 December 2015 (Amounts in Euros unless otherwise stated)
42 of 56