Page 80 - Annual Report 2015 EN
P. 80
Financial Statements
5 Notes to the nancial statements
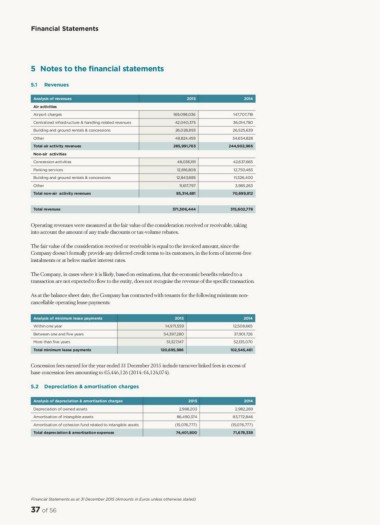
5.1 Revenues 2015 2014
Analysis of revenues 169,098,036 147,707,718
Air activities 42,040,375 36,014,780
Airport charges 26,028,893 26,525,639
Centralized infrastructure & handling related revenues 48,824,459 34,654,828
Building and ground rentals & concessions 285,991,763 244,902,966
Other
Total air activity revenues 48,036,191 42,637,665
Non-air activities 12,816,808 12,750,483
Concession activities 12,843,885 11,326,400
Parking services 3,985,263
Building and ground rentals & concessions 11,617,797 70,699,812
Other 85,314,681
Total non-air activity revenues
Total revenues 371,306,444 315,602,778
Operating revenues were measured at the fair value of the consideration received or receivable, taking
into account the amount of any trade discounts or tax-volume rebates.
The fair value of the consideration received or receivable is equal to the invoiced amount, since the
Company doesn’t formally provide any deferred credit terms to its customers, in the form of interest-free
instalments or at below market interest rates.
The Company, in cases where it is likely, based on estimations, that the economic benefits related to a
transaction are not expected to flow to the entity, does not recognise the revenue of the specific transaction.
As at the balance sheet date, the Company has contracted with tenants for the following minimum non-
cancellable operating lease payments:
Analysis of minimum lease payments 2015 2014
Within one year 14,971,559 12,508,665
Between one and ve years 54,397,280 37,901,726
More than ve years 51,327,147 52,135,070
Total minimum lease payments 120,695,986 102,545,461
Concession fees earned for the year ended 31 December 2015 include turnover linked fees in excess of
base concession fees amounting to €5,446,126 (2014: €4,124,074).
5.2 Depreciation & amortisation charges
Analysis of depreciation & amortisation charges 2015 2014
Depreciation of owned assets 2,988,203 2,982,269
Amortisation of intangible assets 86,490,374 83,772,846
Amortisation of cohesion fund related to intangible assets (15,076,777) (15,076,777)
Total depreciation & amortisation expenses 74,401,800 71,678,338
Financial Statements as at 31 December 2015 (Amounts in Euros unless otherwise stated)
37 of 56
5 Notes to the nancial statements
5.1 Revenues 2015 2014
Analysis of revenues 169,098,036 147,707,718
Air activities 42,040,375 36,014,780
Airport charges 26,028,893 26,525,639
Centralized infrastructure & handling related revenues 48,824,459 34,654,828
Building and ground rentals & concessions 285,991,763 244,902,966
Other
Total air activity revenues 48,036,191 42,637,665
Non-air activities 12,816,808 12,750,483
Concession activities 12,843,885 11,326,400
Parking services 3,985,263
Building and ground rentals & concessions 11,617,797 70,699,812
Other 85,314,681
Total non-air activity revenues
Total revenues 371,306,444 315,602,778
Operating revenues were measured at the fair value of the consideration received or receivable, taking
into account the amount of any trade discounts or tax-volume rebates.
The fair value of the consideration received or receivable is equal to the invoiced amount, since the
Company doesn’t formally provide any deferred credit terms to its customers, in the form of interest-free
instalments or at below market interest rates.
The Company, in cases where it is likely, based on estimations, that the economic benefits related to a
transaction are not expected to flow to the entity, does not recognise the revenue of the specific transaction.
As at the balance sheet date, the Company has contracted with tenants for the following minimum non-
cancellable operating lease payments:
Analysis of minimum lease payments 2015 2014
Within one year 14,971,559 12,508,665
Between one and ve years 54,397,280 37,901,726
More than ve years 51,327,147 52,135,070
Total minimum lease payments 120,695,986 102,545,461
Concession fees earned for the year ended 31 December 2015 include turnover linked fees in excess of
base concession fees amounting to €5,446,126 (2014: €4,124,074).
5.2 Depreciation & amortisation charges
Analysis of depreciation & amortisation charges 2015 2014
Depreciation of owned assets 2,988,203 2,982,269
Amortisation of intangible assets 86,490,374 83,772,846
Amortisation of cohesion fund related to intangible assets (15,076,777) (15,076,777)
Total depreciation & amortisation expenses 74,401,800 71,678,338
Financial Statements as at 31 December 2015 (Amounts in Euros unless otherwise stated)
37 of 56