Page 78 - Annual Report 2015 EN
P. 78
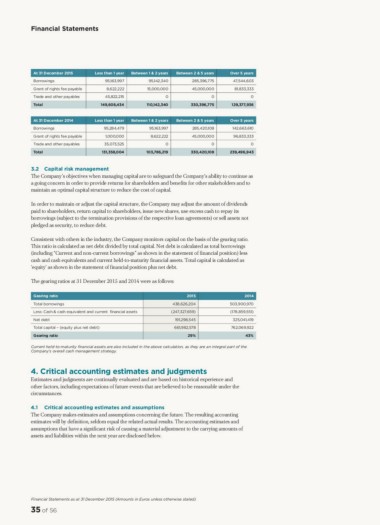
Financial Statements
At 31 December 2015 Less than 1 year Between 1 & 2 years Between 2 & 5 years Over 5 years
Borrowings 95,163,997 95,142,340 285,396,775 47,544,603
Grant of rights fee payable 8,622,222 15,000,000 45,000,000 81,833,333
Trade and other payables 45,822,215 0 0 0
Total 330,396,775 129,377,936
149,608,434 110,142,340
At 31 December 2014 Less than 1 year Between 1 & 2 years Between 2 & 5 years Over 5 years
Borrowings 95,284,479 95,163,997 285,420,108 142,663,610
Grant of rights fee payable 1,000,000 8,622,222 45,000,000 96,833,333
Trade and other payables 35,073,525 0 0 0
Total 330,420,108
131,358,004 103,786,219 239,496,943
3.2 Capital risk management
The Company’s objectives when managing capital are to safeguard the Company’s ability to continue as
a going concern in order to provide returns for shareholders and benefits for other stakeholders and to
maintain an optimal capital structure to reduce the cost of capital.
In order to maintain or adjust the capital structure, the Company may adjust the amount of dividends
paid to shareholders, return capital to shareholders, issue new shares, use excess cash to repay its
borrowings (subject to the termination provisions of the respective loan agreements) or sell assets not
pledged as security, to reduce debt.
Consistent with others in the industry, the Company monitors capital on the basis of the gearing ratio.
This ratio is calculated as net debt divided by total capital. Net debt is calculated as total borrowings
(including “Current and non-current borrowings” as shown in the statement of financial position) less
cash and cash equivalents and current held-to-maturity financial assets. Total capital is calculated as
‘equity’ as shown in the statement of financial position plus net debt.
The gearing ratios at 31 December 2015 and 2014 were as follows:
Gearing ratio 2015 2014
Total borrowings 438,626,204 503,900,970
Less: Cash & cash equivalent and current nancial assets (247,327,659) (178,859,551)
Net debt
Total capital – (equity plus net debt) 191,298,545 325,041,419
Gearing ratio 661,982,578 762,069,922
29% 43%
Current held-to-maturity nancial assets are also included in the above calculation, as they are an integral part of the
Company’s overall cash management strategy.
4. Critical accounting estimates and judgments
Estimates and judgments are continually evaluated and are based on historical experience and
other factors, including expectations of future events that are believed to be reasonable under the
circumstances.
4.1 Critical accounting estimates and assumptions
The Company makes estimates and assumptions concerning the future. The resulting accounting
estimates will by definition, seldom equal the related actual results. The accounting estimates and
assumptions that have a significant risk of causing a material adjustment to the carrying amounts of
assets and liabilities within the next year are disclosed below.
Financial Statements as at 31 December 2015 (Amounts in Euros unless otherwise stated)
35 of 56