Page 32 - Annual Report 2015 EN
P. 32
5 Our Business Units
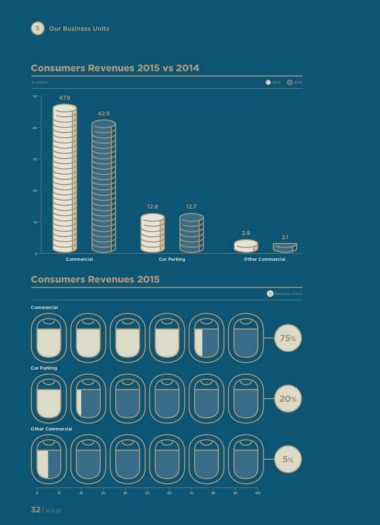
Consumers Revenues 2015 vs 2014 2015 2014
€ million
50 47.9
42.5
40
30
20
12.8 12.7
10
0 Car Parking 2.9 2.1
Commercial Other Commercial
Revenue Share
Consumers Revenues 2015
75%
Commercial
20%
Car Parking
5%
Other Commercial
0 10 20 30 40 50 60 70 80 90 100
32 | aia.gr
Consumers Revenues 2015 vs 2014 2015 2014
€ million
50 47.9
42.5
40
30
20
12.8 12.7
10
0 Car Parking 2.9 2.1
Commercial Other Commercial
Revenue Share
Consumers Revenues 2015
75%
Commercial
20%
Car Parking
5%
Other Commercial
0 10 20 30 40 50 60 70 80 90 100
32 | aia.gr