Page 27 - Annual Report 2015 EN
P. 27
Annual Report 2015
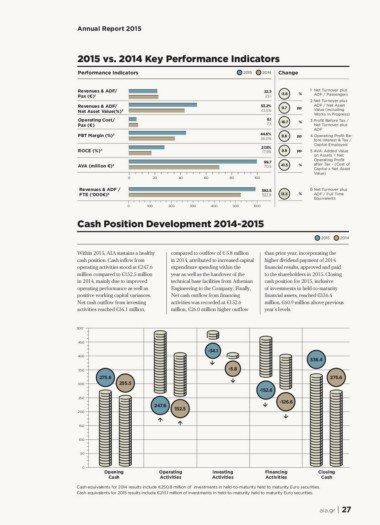
2015 vs. 2014 Key Performance Indicators
Performance Indicators 2015 2014 Change
Revenues & ADF/ 22.3 -3.6 1 Net Turnover plus
Pax (€)1 23.1 % ADF / Passengers
Revenues & ADF/
Net Asset Value(%)2 2 Net Turnover plus
Operating Cost/
Pax (€) 53.2% 9.7 pp ADF / Net Asset
PBT Margin (%)3 43.5% Value (including
Works In Progress)
ROCE (%)4
6.1 -16.7 % 3 Pro t Before Tax /
AVA (million €)5 7.3 Net Turnover plus
0 ADF
Revenues & ADF / 44.6% 8.6 pp 4 Operating Pro t Be-
FTE (‘000€)6 36.0% fore Interest & Tax /
0 27.8% Capital Employed
17.9% 9.9 pp 5 AVA: Added Value
on Assets = Net
99.7 41.5 % Operating Pro t
70.5 after Tax – (Cost of
Capital x Net Asset
Value)
20 40 60 80 100
592.5 13.3 6 Net Turnover plus
522.9 % ADF / Full Time
600 Equivalents
100 200 300 400 500
Cash Position Development 2014-2015
2015 2014
Within 2015, AIA sustains a healthy compared to outlfow of € 5.8 million than prior year, incorporating the
cash position. Cash inflow from in 2014, attributed to increased capital higher dividend payment of 2014
operating activities stood at €247.6 expenditure spending within the financial results, approved and paid
million compared to €152.5 million year as well as the handover of the to the shareholders in 2015. Closing
in 2014, mainly due to improved technical base facilities from Athenian cash position for 2015, inclusive
operating performance as well as Engineering to the Company. Finally, of investments in held-to-maturity
positive working capital variances. Net cash outflow from financing financial assets, reached €336.4
Net cash outflow from investing activities was recorded at €152.6 million, €60.9 million above previous
activities reached €34.1 million, million, €26.0 million higher outflow year’s levels.
500*
450 -34.1 336.4
-5.8 275.6
400
247.6 152.5 -152.6
350 -126.6
275.6
300 255.5
250
200
150
100
50
0 Operating Investing Financing Closing
Activities Activities Activities Cash
Opening
Cash
Cash equivalents for 2014 results include €250.8 million of investments in held-to-maturity held to maturity Euro securities.
Cash equivalents for 2015 results include €213.1 million of investments in held-to-maturity held to maturity Euro securities.
aia.gr | 27