Page 22 - Corporate Responsibility Report 2013
P. 22
03 Our Business
Business Overview
Financial Performance airport charges recorded a decrease with traffic development. Revenues
(-8.7%) compared to prior year from commercial activities dropped
The continuing unfavourable reflecting the traffic decline in terms of (-7.2%), also impacted by traffic decline,
macroeconomic environment in the passengers and aircraft movements reduced spending per passenger and
country has remained a determining of (-3.2% and -8.4% respectively). overall unfavourable market trends.
factor of the traffic evolution and overall For a fifth consecutive year all airport Property revenues are also negatively
business performance in 2013. As such, charges remained unchanged, without affected by adverse market conditions
our efforts were directed towards both any inflation adjustments. AIA’s share and showed a decrease (-17.7%) which
protecting traffic volumes and revenue of the Airport Development Fund (ADF) is mainly attributed to the termination of
streams, as well as achieving savings slightly decreased (-1.7%) compared the lease agreement between Olympic
on the cost side, without however to prior year, reflecting a passenger Engineering and AIA regarding the
compromising our value-for-money traffic drop that was partially offset Technical base. Lastly, Information
strategy. Therefore, despite adverse by the more favourable passenger Technology & Telecommunications
conditions, we have demonstrated mix (countries under the European revenues decreased (-3.6%).
a high level of resilience that led to Economic Area (EEA) agreement vs.
healthy profits, as well as profit margins countries that are not included). With respect to operating costs,
above the average airport industry. continuous efforts to achieve further
Revenues from non-aeronautical savings within the year have been
With regard to revenues, the segments performed overall lower successful, while the AIA’s value-
Aeronautical income (including AIA’s than the previous year by (-9.7%). for-money strategy has not been
share of the Airport Development In specific, revenues from ground compromised. In particular, total
Fund-ADF) contributes the highest handling services and airside operating expenses for 2013 were
portion of total income representing concessions decreased (-3.1%), in line lower (-10.2%) compared to 2012.
58% of total turnover. Revenue from
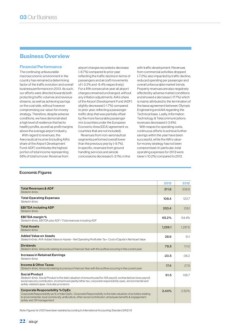
Economic Figures 2013 2012
311.8 338.8
Total Revenues & ADF 108.4 120.7
Stated in €mio. 203.4
65.2% 218.1
Total Operating Expenses 1,226.1 64.4%
Stated in €mio 28.9 1,287.6
79.5
EBITDA including ADF -23.5 51.1
Stated in €mio. 111.0
17.4 -38.2
EBITDA margin % 91.5 27.8
Stated in €mio. EBITDA plus ADF / Total revenues including ADF 106.7
Total Assets 2.44% 2.50%
Stated in €mio
Added Value on Assets
Stated in €mio. AVA: Added Value on Assets = Net Operating Profit after Tax - Cost of Capital x Net Asset Value
Dividends
Stated in €mio. Amounts relating to previous Financial Year with the outflow occuring in the current year.
Increase in Retained Earnings
Stated in €mio
Income & Other Taxes
Stated in €mio. Amounts relating to previous Financial Year with the outflow occuring in the current year.
Social Product
Stated in €mio. Social Product is the total valuation of amounts paid for AIA payroll, contracted services payroll,
social security contribution, income/municipality/other tax, corporate responsibility opex, environmental and
safety-related capex. Includes provisions
Corporate Responsibility % OpEx
Corporate Responsibility as % of total OpEx. Corporate Responsibility is the total valuation of activities relating
to environmental, local community, art&culture, other social contribution, employee benefits & engagement,
safety and CR management.
Note: Figures for 2012 have been restated according to International Accounting Standard (IAS) 19
22 / aia.gr
Business Overview
Financial Performance airport charges recorded a decrease with traffic development. Revenues
(-8.7%) compared to prior year from commercial activities dropped
The continuing unfavourable reflecting the traffic decline in terms of (-7.2%), also impacted by traffic decline,
macroeconomic environment in the passengers and aircraft movements reduced spending per passenger and
country has remained a determining of (-3.2% and -8.4% respectively). overall unfavourable market trends.
factor of the traffic evolution and overall For a fifth consecutive year all airport Property revenues are also negatively
business performance in 2013. As such, charges remained unchanged, without affected by adverse market conditions
our efforts were directed towards both any inflation adjustments. AIA’s share and showed a decrease (-17.7%) which
protecting traffic volumes and revenue of the Airport Development Fund (ADF) is mainly attributed to the termination of
streams, as well as achieving savings slightly decreased (-1.7%) compared the lease agreement between Olympic
on the cost side, without however to prior year, reflecting a passenger Engineering and AIA regarding the
compromising our value-for-money traffic drop that was partially offset Technical base. Lastly, Information
strategy. Therefore, despite adverse by the more favourable passenger Technology & Telecommunications
conditions, we have demonstrated mix (countries under the European revenues decreased (-3.6%).
a high level of resilience that led to Economic Area (EEA) agreement vs.
healthy profits, as well as profit margins countries that are not included). With respect to operating costs,
above the average airport industry. continuous efforts to achieve further
Revenues from non-aeronautical savings within the year have been
With regard to revenues, the segments performed overall lower successful, while the AIA’s value-
Aeronautical income (including AIA’s than the previous year by (-9.7%). for-money strategy has not been
share of the Airport Development In specific, revenues from ground compromised. In particular, total
Fund-ADF) contributes the highest handling services and airside operating expenses for 2013 were
portion of total income representing concessions decreased (-3.1%), in line lower (-10.2%) compared to 2012.
58% of total turnover. Revenue from
Economic Figures 2013 2012
311.8 338.8
Total Revenues & ADF 108.4 120.7
Stated in €mio. 203.4
65.2% 218.1
Total Operating Expenses 1,226.1 64.4%
Stated in €mio 28.9 1,287.6
79.5
EBITDA including ADF -23.5 51.1
Stated in €mio. 111.0
17.4 -38.2
EBITDA margin % 91.5 27.8
Stated in €mio. EBITDA plus ADF / Total revenues including ADF 106.7
Total Assets 2.44% 2.50%
Stated in €mio
Added Value on Assets
Stated in €mio. AVA: Added Value on Assets = Net Operating Profit after Tax - Cost of Capital x Net Asset Value
Dividends
Stated in €mio. Amounts relating to previous Financial Year with the outflow occuring in the current year.
Increase in Retained Earnings
Stated in €mio
Income & Other Taxes
Stated in €mio. Amounts relating to previous Financial Year with the outflow occuring in the current year.
Social Product
Stated in €mio. Social Product is the total valuation of amounts paid for AIA payroll, contracted services payroll,
social security contribution, income/municipality/other tax, corporate responsibility opex, environmental and
safety-related capex. Includes provisions
Corporate Responsibility % OpEx
Corporate Responsibility as % of total OpEx. Corporate Responsibility is the total valuation of activities relating
to environmental, local community, art&culture, other social contribution, employee benefits & engagement,
safety and CR management.
Note: Figures for 2012 have been restated according to International Accounting Standard (IAS) 19
22 / aia.gr