Page 23 - 2board23full
P. 23
04. FINANCIAL PERFORMANCE
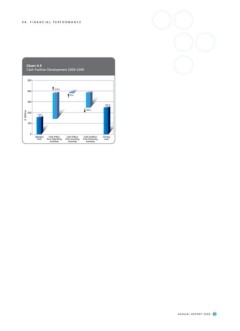
Chart 4.5
Cash Position Development 2008–2009
500 219.9
400
300 10.9
200
243.9
163.7
€ Million 100 150.6
0 Opening Cash Inflow Cash Inflow Cash Outflow Closing
Cash
Cash from Operating from Investing from Financing
Activities Activities Activities
A N N U A L R E P O R T 2 0 0 9 21
Chart 4.5
Cash Position Development 2008–2009
500 219.9
400
300 10.9
200
243.9
163.7
€ Million 100 150.6
0 Opening Cash Inflow Cash Inflow Cash Outflow Closing
Cash
Cash from Operating from Investing from Financing
Activities Activities Activities
A N N U A L R E P O R T 2 0 0 9 21