Page 22 - 2board23full
P. 22
04. FINANCIAL PERFORMANCE
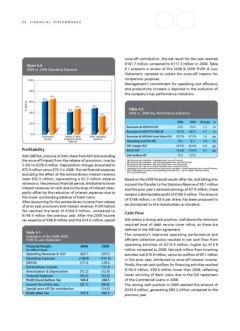
Chart 4.4 once-off contribution, the net result for the year reached
2009 vs. 2008 Operating Expenses €181.7 million compared to €117.3 million in 2008. Table
4.1 presents a review of the 2008 & 2009 Profit & Loss
100.0 Statement, restated to isolate the once-off impacts for
comparison purposes.
80.0 65.2 Management’s commitment for operating cost efficiency
60.0 60.6 and productivity increase is depicted in the evolution of
the company’s key performance indicators.
€ Million 47.2 47.6 Table 4.2
40.5 29.1 2009 vs. 2008 Key Performance Indicators
40.0
20.0 2008 2009 Change in
0.0 08 09 08 09 08 09 Revenues & ADF/PAX (€)1 25.5 25.9 1.2 %
Revenues & ADF/FTE ('000 €)2 557.8 583.7 4.7 %
Outsourced Salaries & Other Other Operating
Services Employee-related Expenses Revenues & ADF/Net Asset Value (%)3 35.5% 37.3% 1.8 pp
Expenses Operating Cost/Pax (€) 9.0 8.7 -3.5 %
Profitability PBT margin (%)4 35.5% 36.4% 0.8 pp
AIA’s EBITDA, inclusive of AIA’s share from ADF and excluding ROCE (%)5 15.0% 14.9% -0.1 pp
the once-off impact from the release of provisions, rose by
2.3% to €278.0 million. Depreciation charges amounted to AVA (million €)6 75.3 125.5
€72.9 million versus €72.2 in 2008. The net financial expenses
excluding the effect of the extraordinary interest revenue 1 Net Turnover plus Subsidies / Passengers (excl. once-off income)
were €52.5 million, representing a €2.3 million adverse 2 Net Turnover plus Subsidies / Full Time Equivalents (excl. once-off income)
variance vs. the previous financial period, attributed to lower 3 Net Turnover plus Subsidies / Net Asset Value (excl. once-off income)
interest revenues on cash due to the drop of interest rates, 4 Profit before Tax / Net turnover plus Subsidies (excl. once-off income)
partly offset by the reduction of interest expenses due to 5 Operating Profit before Interest & Tax (inclusive of subsidies) / Capital Employed (excl. once-off income)
the lower outstanding balance of bank loans. 6 AVA: Added Value on Assets = Net Operating Profit after Tax - Cost of Capital x Net Asset Value
After accounting for the extraordinary income from release
of prior year provisions and interest revenue, Profit before (incl. once-off income)
Tax reached the level of €264.5 million, compared to
€149.4 million the previous year. After the 2009 Income Based on the 2009 financial results after tax, and taking into
tax expense of €68.8 million and the €14.0 million special account the Transfer to the Statutory Reserve of €9.1 million
and the prior year’s retained earnings of €7.9 million, there
remains a distributable profit of €180.5 million. The amount
of €168 million, i.e. €5.6 per share, has been proposed to
be distributed to the shareholders as dividend.
Table 4.1 2008 2009 Cash Flow
Highlights of the 2008–2009
Profit & Loss Statement 420.7 419.5 AIA retains a strong cash position, well above the minimum
(148.8) (141.5) required level of debt service cover ratios, as these are
Financial Results 271.9 278.0 defined in the EIB loan agreement.
111.9 The company’s improved operating performance and
(in million Euros) (72.2) (72.9) efficient collection policy resulted in net cash flow from
(50.2) (52.5) operating activities of €219.9 million, higher by €13.8
Operating Revenues & ADF 149.4 264.5 million compared to 2008. Net cash inflow from investing
Operating Expenses (32.1) (68.8) activities was €10.9 million, versus an outflow of €9.1 million
EBITDA (14.0) in the prior year, attributed to once-off interest income.
Extraordinary Income 117.3 181.7 Finally, the net cash outflow for financing activities reached
Amortisation & Depreciation €150.6 million, €59.6 million lower than 2008, reflecting
Financial Expenses lower servicing of Bank Loans due to the full repayment
Profit (Loss) before Tax of the Commercial Loans in 2008.
Income Tax of the year The closing cash position in 2009 reached the amount of
Special once off Tax contribution €243.9 million, generating €80.2 million compared to the
Profit after Tax previous year.