Page 28 - Annual Report 2013
P. 28
5 Our Business
Units
In line with the corporate philosophy, AIA’s organisational structure is designed around four
Business Units (Aviation, Consumers, Property and IT & Telecommunications). These units have a
combined responsibility for operational excellence and business development. To further enhance
this role, we have introduced a Value Based Management (VBM) methodology, which measures
the performance of the Business Units against predefined targets on both financial and non-
financial metrics and parameters (e.g. systems’ efficiency, quality of services, safety of operations,
environmental responsibility, personnel safety, etc).
AVA per Business Unit
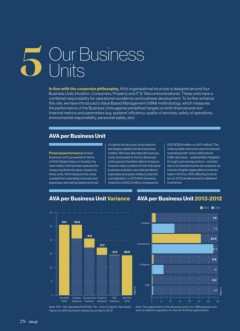
of capital into account, since airports 2012 (€28.9 million vs. €51.1 million). The
are largely capital intensive business unfavourable outcome is due to reduced
Financial performance of each entities. We have allocated all revenues, operating profit, mainly attributed to
Business Unit is presented in terms costs and assets to the four Business traffic decrease – substantially mitigated
of AVA (Added Value on Assets), the Units and are therefore able to measure through cost savings actions - and also
main metric that has been selected for financial value creation of their individual due to increased income tax expense, as
measuring financial value creation by business activities, also taking indirect a result of higher applicable income tax
these units. AVA measures the value expenses and asset-related costs into rates in 2013 vs. 2012 affecting income
created from operating revenues and consideration. In 2013 AVA showed a tax on 2013 dividends and on deferred
expenses, also taking assets and cost reduction of €22.2 million compared to income tax.
AVA per Business Unit Variance AVA per Business Unit 2013-2012
2013 2012
60
1.9
51.1 -10.0 Aviation
50
11.9
-6.6
40 25.9
-5.3 Consumers
32.5
30 -0.3 28.9
0.8
Property
20
6.1
10 0.3
IT&T
Million € 0.6 Million €
0
AIA AVA Aviation Consumers Property IT&T AIA AVA
2012 Variance Variance Variance Variance 2013 0 5 10 15 20 25 30 35
Note: AVA = Net Operating Profit After Tax - Cost of Capital x Net Assets. Note: The segmentation of the Business Units is for VBM purposes only
Figures for 2012 have been restated according to IAS 19 and not related to regulatory Air-Non Air Acitivites segmentation
28 / aia.gr
Units
In line with the corporate philosophy, AIA’s organisational structure is designed around four
Business Units (Aviation, Consumers, Property and IT & Telecommunications). These units have a
combined responsibility for operational excellence and business development. To further enhance
this role, we have introduced a Value Based Management (VBM) methodology, which measures
the performance of the Business Units against predefined targets on both financial and non-
financial metrics and parameters (e.g. systems’ efficiency, quality of services, safety of operations,
environmental responsibility, personnel safety, etc).
AVA per Business Unit
of capital into account, since airports 2012 (€28.9 million vs. €51.1 million). The
are largely capital intensive business unfavourable outcome is due to reduced
Financial performance of each entities. We have allocated all revenues, operating profit, mainly attributed to
Business Unit is presented in terms costs and assets to the four Business traffic decrease – substantially mitigated
of AVA (Added Value on Assets), the Units and are therefore able to measure through cost savings actions - and also
main metric that has been selected for financial value creation of their individual due to increased income tax expense, as
measuring financial value creation by business activities, also taking indirect a result of higher applicable income tax
these units. AVA measures the value expenses and asset-related costs into rates in 2013 vs. 2012 affecting income
created from operating revenues and consideration. In 2013 AVA showed a tax on 2013 dividends and on deferred
expenses, also taking assets and cost reduction of €22.2 million compared to income tax.
AVA per Business Unit Variance AVA per Business Unit 2013-2012
2013 2012
60
1.9
51.1 -10.0 Aviation
50
11.9
-6.6
40 25.9
-5.3 Consumers
32.5
30 -0.3 28.9
0.8
Property
20
6.1
10 0.3
IT&T
Million € 0.6 Million €
0
AIA AVA Aviation Consumers Property IT&T AIA AVA
2012 Variance Variance Variance Variance 2013 0 5 10 15 20 25 30 35
Note: AVA = Net Operating Profit After Tax - Cost of Capital x Net Assets. Note: The segmentation of the Business Units is for VBM purposes only
Figures for 2012 have been restated according to IAS 19 and not related to regulatory Air-Non Air Acitivites segmentation
28 / aia.gr