Page 25 - Annual Report 2013
P. 25
Annual Report 2013
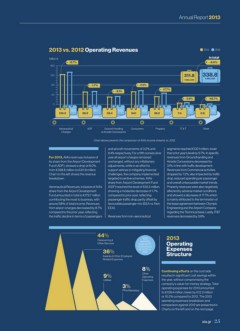
2013 vs. 2012 Operating Revenues 2013 2012
Million € in total
-8.7% -8.0%
160
120 311.8 338.8
€ milliOn € milliOn
80 -1.7% -7.2%
-17.7%
-3.1%
40
-3.6% -48.7%
0
136.2 56.4 34.5 58.3 44.0 7.7 1.8
124.3 55.5 33.4 54.1 36.2 7.4 0.9
Aeronautical ADF Ground Handling Consumers Property IT & T Other
Charges & Airside Concessions
Chart above presents the comparison of AIA’s income streams vs. 2012.
and aircraft movements of 3.2% and segments reached €132.1 million, lower
8.4% respectively. For a fifth consecutive than prior year’s level by 9.7%. In specific,
For 2013, AIA’s revenues inclusive of year all airport charges remained revenues from Groundhandling and
its share from the Airport Development unchanged, without any inflationary Airside Concessions decreased by
Fund (ADF), showed a drop of 8.0%, adjustments, while in an effort to 3.1%, in line with traffic development.
from €338.8 million to €311.8 million. support airlines in mitigating financial Revenues from Commercial activities
Chart on the left shows the revenue challenges, the company implemented dropped by 7.2%, also impacted by traffic
breakdown. targeted incentive schemes. AIA’s drop, reduced spending per passenger
share from Airport Development Fund and overall unfavourable market trends.
Aeronautical Revenues, inclusive of AIA’s (ADF) reached the level of €55.5 million, Property revenues were also negatively
share from the Airport Development showing a moderate decrease of 1.7% affected by adverse market conditions
Fund amounted in total to €179.7 million compared to prior year, reflecting and showed a decrease of 17.7% which
contributing the most to business, with passenger traffic drop partly offset by is mainly attributed to the termination of
around 58% of total income. Revenues favourable passenger mix (EEA vs. Non the lease agreement between Olympic
from airport charges decreased by 8.7% EEA). Engineering and the Airport Company
compared to the prior year, reflecting regarding the Technical base. Lastly, IT&T
the traffic decline in terms of passengers Revenues from non-aeronautical revenues decreased by 3.6%.
44% 2013
Total
Outsourcing & operating
Other Services expenses of Operating
2013 lowered Expenses
36% by 10.2% vs Structure
2012
Salaries & Other Employee
Related Expenses
8% Continuing efforts on the cost side
9% Other resulted in significant cost savings within
Operating
Utilities Expenses the year, without compromising the
3% company’s value-for-money strategy. Total
operating expenses for 2013 amounted
PR & Marketing
to €108.4 million, lower by €12.3 million
or 10.2% compared to 2012. The 2013
operating expenses breakdown and
comparison against 2012 are presented in
Charts on the left and on the next page.
aia.gr / 25