Page 27 - Annual Report 2013
P. 27
Annual Report 2013
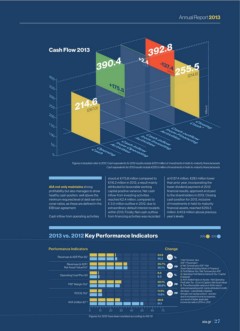
Cash Flow 2013
Million €
Figures in brackets refer to 2012. Cash equivalents for 2012 results include €201.1 million of investments in held-to-maturity financial assets.
Cash equivalents for 2013 results include €220.5 million of investments in held-to-maturity financial assets.
stood at €175.8 million compared to at €137.4 million, €28.1 million lower
€116.2 million in 2012, a result mainly than prior year, incorporating the
AIA not only maintains strong attributed to favourable working lower dividend payment of 2012
profitability but also manages to show capital positive variance. Net cash financial results, approved and paid
healthy cash position, well above the inflow from investing activities to the shareholders in 2013. Closing
minimum required level of debt service reached €2.4 million, compared to cash position for 2013, inclusive
cover ratios, as these are defined in the € 3.0 million outflow in 2012, due to of investments in held-to-maturity
EIB loan agreement. extraordinary default interest receipts financial assets, reached €255.5
within 2013. Finally, Net cash outflow million, €40.9 million above previous
Cash inflow from operating activities from financing activities was recorded year’s levels.
2013 vs. 2012 Key Performance Indicators 2013 2012
Performance Indicators Change
24.9
Revenues & ADF/Pax (€) 1 -5.0 %
26.2 1. Net Turnover plus
Revenues & ADF/ 35.7% ADF / Passengers
Net Asset Value(%) 2 36.1% -0.4 pp 2. Net Turnover plus ADF / Net
Asset Value (including Works In Progress)
8.6 3. Profit Before Tax / Net Turnover plus ADF
Operating Cost/Pax (€) 9.3 -7.3 % 4. Operating Profit Before Interest & Tax / Capital
Employed
5. AVA: Added Value on Assets = Net Operating
30.1% Profit after Tax - (Cost of Capital x Net Asset Value)
PBT Margin (%) 3 28.8% 1.4 pp 6. The unfavourable variance in AVA is due to
reduced operating profit, mainly attributed to trac
11.5% decrease – substan tially mitigated
ROCE (%) 4 11.8% -0.3 pp through cost savings ac tions - and also
due to increased income tax expense,
28.9 as a result of higher appli cable
AVA (million €) 5, 6 51.1 income tax rates in 2013 vs. 2012
0 10 20 30 40 50 60 70
Figures for 2012 have been restated according to IAS 19
aia.gr / 27