Page 26 - 2board23full
P. 26
05. Our Business Units
The company has established four Business Units (Aviation, AVIATION BUSINESS UNIT
Consumers, Property and IT & Telecommunications), which Throughout the year, the Aviation Business Unit (ABU)
combine operational responsibilities with business activities. continued to ensure safe, orderly, and efficient aviation
The performance of all units is measured through an established operations, offering high-quality services and facilities
Value Based Management (VBM) methodology, which targets to aircraft operators. Disruptions due to severe weather
and measures achievements on both financial and non-financial conditions or industrial actions were handled efficiently
metrics and parameters (e.g. quality of services, environmental while maintaining the highest possible level of safety, and
responsibility, public image, personnel safety, etc.). always minding about passenger convenience.
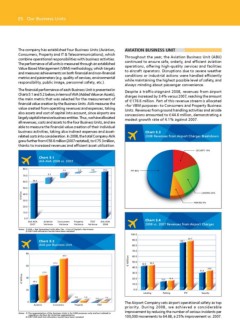
Despite a traffic-stagnant 2008, revenues from airport
The financial performance of each Business Unit is presented in charges increased by 3.4% versus 2007, reaching the amount
Charts 5.1 and 5.2 below, in terms of AVA (Added Value on Assets), of €176.6 million. Part of this revenue stream is allocated
the main metric that was selected for the measurement of –for VBM purposes– to Consumers and Property Business
financial value creation by the Business Units. AVA measures the Units. Revenues from ground handling activities and airside
value created from operating revenues and expenses, taking concessions amounted to €44.6 million, demonstrating a
also assets and cost of capital into account, since airports are modest growth rate of 4.1% against 2007.
largely capital intensive business entities. Thus, we have allocated
all revenues, costs and assets to the four Business Units, and are Chart 5.3
able to measure the financial value creation of their individual 2008 Revenues from Airport Charges Breakdown
business activities, taking also indirect expenses and asset-
related costs into consideration. In 2008, the total Company AVA SECURITY 19%
grew further from €56.6 million (2007 restated), to €75.3 million,
thanks to increased revenues and efficient asset utilisation. PTF 48%
Chart 5.1
AIA AVA 2008 vs. 2007
80.0 7.5 1.2 0.6 75.3
70.0 9.5
60.0 56.6
50.0
€ Million 40.0 LANDING 24%
PARKING 9%
30.0
20.0
10.0
0.0 Aviation Consumers Property IT&T AIA AVA Chart 5.4
Variance Variance Variance 2008 vs. 2007 Revenues from Airport Charges
AIA AVA Variance 2008
2007
Notes: 1) AVA = Net Operating Profit after Tax – Cost of Capital x Net Assets
2) 2007 AVA allocation results have been restated
Chart 5.2 100.0 87.7
AVA per Business Unit 90.0 85.1
80.0
80 44.7 70.0 07 08
37.3 60.0
€ Million 50.0 42.8 43.4 PTF
60 40.0
€ Million 27.5 30.0 07 08 33.6
40 20.0 31.9
18.0 10.0 Landing 14.3 15.4
0.0 07 08
20 07 08
Security
Parking
0 07 08 07 08 0.8 2.0 0.4 1.0 The Airport Company sets airport operational safety as top
Property IT&T priority. During 2008, we achieved a considerable
Aviation Consumers improvement by reducing the number of serious incidents per
100,000 movements to 64.68, a 25% improvement vs. 2007.
Notes: 1) The segmentation of the Business Units is for VBM purposes only and not related to
regulatory Air/Non-Air Activities segmentation
2) 2007 AVA and Unit allocation results have been restated
The company has established four Business Units (Aviation, AVIATION BUSINESS UNIT
Consumers, Property and IT & Telecommunications), which Throughout the year, the Aviation Business Unit (ABU)
combine operational responsibilities with business activities. continued to ensure safe, orderly, and efficient aviation
The performance of all units is measured through an established operations, offering high-quality services and facilities
Value Based Management (VBM) methodology, which targets to aircraft operators. Disruptions due to severe weather
and measures achievements on both financial and non-financial conditions or industrial actions were handled efficiently
metrics and parameters (e.g. quality of services, environmental while maintaining the highest possible level of safety, and
responsibility, public image, personnel safety, etc.). always minding about passenger convenience.
Despite a traffic-stagnant 2008, revenues from airport
The financial performance of each Business Unit is presented in charges increased by 3.4% versus 2007, reaching the amount
Charts 5.1 and 5.2 below, in terms of AVA (Added Value on Assets), of €176.6 million. Part of this revenue stream is allocated
the main metric that was selected for the measurement of –for VBM purposes– to Consumers and Property Business
financial value creation by the Business Units. AVA measures the Units. Revenues from ground handling activities and airside
value created from operating revenues and expenses, taking concessions amounted to €44.6 million, demonstrating a
also assets and cost of capital into account, since airports are modest growth rate of 4.1% against 2007.
largely capital intensive business entities. Thus, we have allocated
all revenues, costs and assets to the four Business Units, and are Chart 5.3
able to measure the financial value creation of their individual 2008 Revenues from Airport Charges Breakdown
business activities, taking also indirect expenses and asset-
related costs into consideration. In 2008, the total Company AVA SECURITY 19%
grew further from €56.6 million (2007 restated), to €75.3 million,
thanks to increased revenues and efficient asset utilisation. PTF 48%
Chart 5.1
AIA AVA 2008 vs. 2007
80.0 7.5 1.2 0.6 75.3
70.0 9.5
60.0 56.6
50.0
€ Million 40.0 LANDING 24%
PARKING 9%
30.0
20.0
10.0
0.0 Aviation Consumers Property IT&T AIA AVA Chart 5.4
Variance Variance Variance 2008 vs. 2007 Revenues from Airport Charges
AIA AVA Variance 2008
2007
Notes: 1) AVA = Net Operating Profit after Tax – Cost of Capital x Net Assets
2) 2007 AVA allocation results have been restated
Chart 5.2 100.0 87.7
AVA per Business Unit 90.0 85.1
80.0
80 44.7 70.0 07 08
37.3 60.0
€ Million 50.0 42.8 43.4 PTF
60 40.0
€ Million 27.5 30.0 07 08 33.6
40 20.0 31.9
18.0 10.0 Landing 14.3 15.4
0.0 07 08
20 07 08
Security
Parking
0 07 08 07 08 0.8 2.0 0.4 1.0 The Airport Company sets airport operational safety as top
Property IT&T priority. During 2008, we achieved a considerable
Aviation Consumers improvement by reducing the number of serious incidents per
100,000 movements to 64.68, a 25% improvement vs. 2007.
Notes: 1) The segmentation of the Business Units is for VBM purposes only and not related to
regulatory Air/Non-Air Activities segmentation
2) 2007 AVA and Unit allocation results have been restated