Page 22 - 2board23full
P. 22
04. Financial Performance
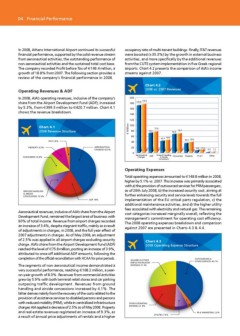
In 2008, Athens International Airport continued its successful occupancy rate of multi-tenant buildings. Finally, IT&T revenues
financial performance, supported by the solid revenue stream were boosted (+35.3%) by the growth in external business
from aeronautical activities, the outstanding performance of activities, and more specifically by the additional revenues
non-aeronautical activities and the sustained total cost base. from the CUTE system implementation in five Greek regional
The company recorded Profit before Tax of €149.4 million, a airports. Chart 4.2 presents the comparison of AIA’s income
growth of 18.8% from 2007. The following section provides a streams against 2007.
review of the company’s financial performance in 2008.
Chart 4.2
Operating Revenues & ADF 2008 vs. 2007 Revenues
In 2008, AIA’s operating revenues, inclusive of the company’s 200
share from the Airport Development Fund (ADF), increased 180 170.8 176.6
by 5.3%, from €399.5 million to €420.7 million. Chart 4.1
shows the revenue breakdown. 160
140
120
Chart 4.1 € Million 100
2008 Revenue Structure
80 73.0 75.8 66.8 70.7
IT&T 2.8%
PROPERTY 9.5% 60 42.9 44.6 36.4 39.8
40
CONSUMERS 16.8%
AERONAUTICAL 20 07 08 07 08 07 08 07 08 8.8 11.9 0.9 1.2
CHARGES 42.0% 0 07 08 07 08 Other
Aeronautical ADF Ground Handling Consumers Property IT & T
Charges & Airside
Concessions
GROUND HANDLING Operating Expenses
& AIRSIDE
CONCESSIONS 10.6% Total operating expenses amounted to €148.8 million in 2008,
higher by 5.1% vs. 2007. This increase was primarily associated
ADF 18% with a) the provision of outsourced services for PRM passengers,
as of 26th July 2008, b) the increased security cost, aiming at
Aeronautical revenues, inclusive of AIA’s share from the Airport further enhancing security and service levels towards the full
Development Fund, remained the largest area of business with implementation of the EU critical parts regulation, c) the
60% of total income. Revenue from airport charges recorded additional maintenance activities, and d) the higher utility
an increase of 3.4%, despite stagnant traffic, mainly as a result fees associated with electricity and natural gas. The remaining
of adjustments in charges, in 2008, and the full year effect of cost categories increased marginally overall, reflecting the
2007 adjustments in charges. As of May 2008, an adjustment management’s commitment for operating cost efficiency.
of 2.5% was applied in all airport charges excluding security The 2008 operating expenses breakdown and comparison
charge. AIA’s share from the Airport Development Fund (ADF) against 2007 are presented in Charts 4.3 & 4.4.
reached the level of €75.8 million, posting an increase of 3.9%,
attributed to once-off additional ADF amounts, following the Chart 4.3
completion of the official reconciliation with HCAA for prior periods. 2008 Operating Expense Structure
The segments of non-aeronautical income demonstrated a SALARIES & OTHER OUTSOURCING &
very successful performance, reaching €168.2 million, a year- EMPLOYEE-RELATED OTHER SERVICES 40.7%
on-year growth of 8.0%. Revenues from commercial activities EXPENSES 27.3%
grew by 5.9% with both terminal retail stores and car parking
outpacing traffic development. Revenues from ground OTHER OPERATING PR & MARKETING 2.6%
handling and airside concessions increased by 4.1%. The EXPENSES 21.8%
latter derives mainly from the recovery of the costs related to the
provision of assistance services to disabled persons and persons UTILITIES 7.6%
with reduced mobility (PRM), while in centralised infrastructure
charges AIA applied a decrease of 2.5% as of May 2008. Property
and real estate revenues registered an increase of 9.3%, as
a result of annual price adjustments of rentals and a higher