Page 23 - 2board23full
P. 23
22-23
Chart 4.4 Table 4.2
2008 vs. 2007 Operating Expenses 2008 vs. 2007 Key Performance Indicators
80 2007 2008 Change in
Revenues & ADF/PAX (€)1 24.2 25.5 5.8 %
60.6 Revenues & ADF/FTE ('000 €)2 527.8 557.8 5.7 %
60 49.3 Revenues & ADF/Net Asset Value (%)3 32.2% 35.5% 3.3 pp
53.3
47.6 Operating Cost/Pax (€) 8.6 9.0 5.6 %
€ Million 40 39.0 40.5 PBT margin (%)4 31.5% 35.5% 4.0 pp
ROCE (%)5 13.3% 15.0% 1.7 pp
AVA (million €)6 56.6 75.3
20 1 Net Turnover plus Subsidies / Passengers
2 Net Turnover plus Subsidies / Full Time Equivalents
0 07 08 07 08 07 08 3 Net Turnover plus Subsidies / Net Asset Value
4 Profit before Tax / Net turnover plus Subsidies
Outsourced Services Salaries & Other Other Operating 5 Operating Profit before Interest & Tax (inclusive of subsidies) / Capital Employed
Employee-related Expenses 6 AVA: Added Value on Assets = Net Operating Profit after Tax - Cost of Capital x Net Asset Value
Expenses Based on the 2008 financial results after tax and taking into
account the Transfer to the Statutory Reserve of €5.9 million
Profitability and the prior year’s retained earnings of €1.4 million, there
remains a distributable profit of €112.9 million. The amount
AIA’s EBITDA, inclusive of AIA’s share from ADF, rose by 5.4% of €105.0 million, i.e. €3.5 per share, has been proposed
to €271.9 million. Depreciation charges amounted to €72.2 to be distributed to the shareholders as dividend.
million, versus €72.6 in 2007. The net financial expenses
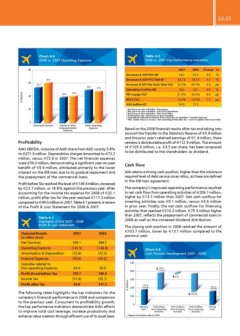
were €50.2 million, demonstrating a significant year-on-year Cash Flow
benefit of €9.4 million, attributed primarily to the lower
interest on the EIB loan due to its gradual repayment and AIA retains a strong cash position, higher than the minimum
the prepayment of the commercial loans. required level of debt service cover ratios, as these are defined
in the EIB loan agreement.
Profit before Tax reached the level of €149.4 million, increased
by €23.7 million, or 18.8% against the previous year. After The company’s improved operating performance resulted
accounting for the income tax expense for 2008 of €32.1 in net cash flow from operating activities of €206.1 million,
million, profit after tax for the year reached €117.3 million higher by €13.7 million than 2007. Net cash outflow for
compared to €94.0 million in 2007. Table 4.1 presents a review investing activities was €9.1 million, versus €5.6 million
of the Profit & Loss Statement for 2008 & 2007. in prior year. Finally, the net cash outflow for financing
activities that reached €210.2 million, €75.3 million higher
Table 4.1 than 2007, reflects the prepayment of commercial loans in
Highlights of the 2007—2008 2008 as well as the increased dividend distribution.
Profit & Loss Statement
The closing cash position in 2008 reached the amount of
Financial Results 2007 2008 €163.7 million, lower by €13.1 million compared to the
previous year.
(in million Euros) 335.1 364.7
(141.5) (148.8) Chart 4.5
Net Turnover (72.6) (72.2) Cash Position Development 2007—2008
(59.6) (50.2)
Operating Expenses 500
64.4 56.0
Amortisation & Depreciation 125.7 149.4 400 206.1
(31.8) (32.1) (192.4)
Financial Expenses 94.0 117.3
9.1
Subsidies related to (5.6)
Non-operating Expenses
Profit (Loss) before Tax € Million 300 176.8 163.7
200 (124.8) (176.8)
Income Tax
Profit after Tax
The following table highlights the key indicators for the 100 210.2
company’s financial performance in 2008 and comparison (134.8)
to the previous year. Concurrent to profitability growth,
the key performance indicators demonstrate AIA’s efforts 0 Cash Outflow Cash Outflow Closing
to improve total cost leverage, increase productivity and Opening Cash Inflow from Investing from Financing Cash
Cash from Operating
enhance value creation through efficient use of its asset base. Activities Activities Activities
* Figures in brackets refer to 2007
Chart 4.4 Table 4.2
2008 vs. 2007 Operating Expenses 2008 vs. 2007 Key Performance Indicators
80 2007 2008 Change in
Revenues & ADF/PAX (€)1 24.2 25.5 5.8 %
60.6 Revenues & ADF/FTE ('000 €)2 527.8 557.8 5.7 %
60 49.3 Revenues & ADF/Net Asset Value (%)3 32.2% 35.5% 3.3 pp
53.3
47.6 Operating Cost/Pax (€) 8.6 9.0 5.6 %
€ Million 40 39.0 40.5 PBT margin (%)4 31.5% 35.5% 4.0 pp
ROCE (%)5 13.3% 15.0% 1.7 pp
AVA (million €)6 56.6 75.3
20 1 Net Turnover plus Subsidies / Passengers
2 Net Turnover plus Subsidies / Full Time Equivalents
0 07 08 07 08 07 08 3 Net Turnover plus Subsidies / Net Asset Value
4 Profit before Tax / Net turnover plus Subsidies
Outsourced Services Salaries & Other Other Operating 5 Operating Profit before Interest & Tax (inclusive of subsidies) / Capital Employed
Employee-related Expenses 6 AVA: Added Value on Assets = Net Operating Profit after Tax - Cost of Capital x Net Asset Value
Expenses Based on the 2008 financial results after tax and taking into
account the Transfer to the Statutory Reserve of €5.9 million
Profitability and the prior year’s retained earnings of €1.4 million, there
remains a distributable profit of €112.9 million. The amount
AIA’s EBITDA, inclusive of AIA’s share from ADF, rose by 5.4% of €105.0 million, i.e. €3.5 per share, has been proposed
to €271.9 million. Depreciation charges amounted to €72.2 to be distributed to the shareholders as dividend.
million, versus €72.6 in 2007. The net financial expenses
were €50.2 million, demonstrating a significant year-on-year Cash Flow
benefit of €9.4 million, attributed primarily to the lower
interest on the EIB loan due to its gradual repayment and AIA retains a strong cash position, higher than the minimum
the prepayment of the commercial loans. required level of debt service cover ratios, as these are defined
in the EIB loan agreement.
Profit before Tax reached the level of €149.4 million, increased
by €23.7 million, or 18.8% against the previous year. After The company’s improved operating performance resulted
accounting for the income tax expense for 2008 of €32.1 in net cash flow from operating activities of €206.1 million,
million, profit after tax for the year reached €117.3 million higher by €13.7 million than 2007. Net cash outflow for
compared to €94.0 million in 2007. Table 4.1 presents a review investing activities was €9.1 million, versus €5.6 million
of the Profit & Loss Statement for 2008 & 2007. in prior year. Finally, the net cash outflow for financing
activities that reached €210.2 million, €75.3 million higher
Table 4.1 than 2007, reflects the prepayment of commercial loans in
Highlights of the 2007—2008 2008 as well as the increased dividend distribution.
Profit & Loss Statement
The closing cash position in 2008 reached the amount of
Financial Results 2007 2008 €163.7 million, lower by €13.1 million compared to the
previous year.
(in million Euros) 335.1 364.7
(141.5) (148.8) Chart 4.5
Net Turnover (72.6) (72.2) Cash Position Development 2007—2008
(59.6) (50.2)
Operating Expenses 500
64.4 56.0
Amortisation & Depreciation 125.7 149.4 400 206.1
(31.8) (32.1) (192.4)
Financial Expenses 94.0 117.3
9.1
Subsidies related to (5.6)
Non-operating Expenses
Profit (Loss) before Tax € Million 300 176.8 163.7
200 (124.8) (176.8)
Income Tax
Profit after Tax
The following table highlights the key indicators for the 100 210.2
company’s financial performance in 2008 and comparison (134.8)
to the previous year. Concurrent to profitability growth,
the key performance indicators demonstrate AIA’s efforts 0 Cash Outflow Cash Outflow Closing
to improve total cost leverage, increase productivity and Opening Cash Inflow from Investing from Financing Cash
Cash from Operating
enhance value creation through efficient use of its asset base. Activities Activities Activities
* Figures in brackets refer to 2007