Page 28 - Ath Airport Profile
P. 28
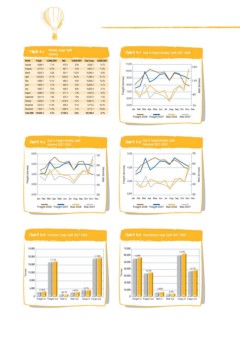
Table 4.1 Monthly Cargo Uplift Chart 4.1 Mail & Freight Monthly Uplift 2007-2008
(tonnes)
Month Freight %2008/2007 Mail %2008/2007 Total Cargo %2008/2007
7.1% 970.3 2.9% 9,058.7 6.7%
January 8,088.4 12.4% 887.1 4.5% 9,657.5 11.6% 11,000 1,300
-2.6% 924.1 10,569.4 -3.6% 10,000 1,100
February 8,770.4 21.7% 1,033.8 -12.5% 11,286.4 21.7% 9,000
13.1% 969.5 22.3% 10,938.2 12.3% 8,000
March 9,645.3 2.1% 925.9 5.0% 10,620.3 2.1%
2.5% 958.2 2.5% 10,825.9 3.1%
April 10,252.6 0.4% 811.4 9.8% 9,497.8 0.5% Freight (tonnes) Mail (tonnes)
1.0% 975.5 1.3% 10,787.3 1.5%
May 9,968.7 1.7% 1,018.6 7.0% 10,667.0 1.4%
959.3 -0.7% 9,174.6
June 9,694.4 -11.2% 1,268.9 -3.1% 9,113.1 -10.4%
-11.5% 11,702.6 1.1% -10.0%
July 9,867.7 2.9% 122,196.0 7,000
2.7% 2.7% 6,000
August 8,686.4 900
September 9,811.8
October 9,648.3
November 8,215.3 5,000 700
December 7,844.1 Jan Feb Mar Apr May Jun Jul Aug Sep Oct Nov Dec
Total 2008 110,493.4
Freight 2008 Freight 2007 Mail 2008 Mail 2007
Chart 4.2 Mail & Freight Monthly Uplift Chart 4.3 Mail & Freight Monthly Uplift
Inbound 2007-2008 Outbound 2007-2008
6,000 700 5,000 700
600
Freight (tonnes) 5,000 500 Mail (tonnes) 600
Freight (tonnes) 4,000
4,000 Mail (tonnes)
500
3,000 400
3,000
2,000 300 400
Jan Feb Mar Apr May Jun Jul Aug Sep Oct Nov Dec 2,000 300
Jan Feb Mar Apr May Jun Jul Aug Sep Oct Nov Dec
Freight 2008 Freight 2007 Mail 2008 Mail 2007
Freight 2008 Freight 2007 Mail 2008 Mail 2007
Chart 4.4 Domestic Cargo Uplift 2007-2008 Chart 4.5 International Cargo Uplift 2007-2008
24,000 70,000 +3.4%
20,000 60,000 +2.8%
16,000 +1.4% 50,000
+1.1%
Tonnes 40,000 +3.0% +2.7%
Tonnes 30,000
12,000
8,000 20,000
4,000 +7.8% +4.3% -3.1% 10,000 +9.9%
0
-24.7% 07 08 07 08 07 08 -0.4%
Mail out Cargo in Cargo out 07 08
07 08 07 08 07 08 0 07 08 07 08 07 08 Mail out 07 08 07 08
Freight in Freight out Mail in Cargo in Cargo out
Freight in Freight out Mail in