Page 80 - Annual Report 2013
P. 80
Financial Statements
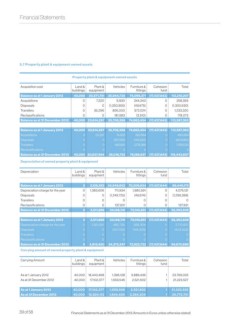
5.7 Property plant & equipment-owned assets
Property plant & equipment-owned assets
Acquisition cost Land & Plant & Vehicles Furniture & Cohesion Total
buildings equipment fittings fund
Balance as at 1 January 2012 40,000 20,571,751 35,944,730 74,099,371 (17,437,643) 113,218,207
Acquisitions 0 7,220 6,930 244,243 0 258,393
Disposals 0 0 (1,250,955) (49,675) 0 (1,300,630)
Transfers 0 35,296 826,000 372,024 0 1,233,320
Reclassifications 0 0 181,583 (3,510) 0 178,073
Balance as at 31 December 2012 40,000 20,614,267 35,708,288 74,662,454 (17,437,643) 113,587,363
Balance as at 1 January 2013 40,000 20,614,267 35,708,288 74,662,454 (17,437,643) 113,587,363
Acquisitions 0 23,297 74,933 392,664 0 490,894
Disposals 0 0 (257,130) (146,550) 0 (403,680)
Transfers 0 0 490,661 1,278,369 0 1,769,030
Reclassifications 0 0 0 0 0 0
Balance as at 31 December 2013 40,000 20,637,564 36,016,752 76,186,937 (17,437,643) 115,443,607
Depreciation of owned property plant & equipment
Depreciation Land & Plant & Vehicles Furniture & Cohesion Total
buildings equipment fittings fund
Balance as at 1 January 2012 0 2,128,283 34,548,602 70,209,934 (17,437,644) 89,449,175
Depreciation charge for the year 0 1,383,606 711,934 1,980,591 0 4,076,131
Disposals 0 0 (1,249,725) (49,674) 0 (1,299,399)
Transfers 0 0 0 0 0 0
Reclassifications 0 0 137,931 0 0 137,931
Balance as at 31 December 2012 0 3,511,889 34,148,741 72,140,851 (17,437,644) 92,363,838
Balance as at 1 January 2013 0 3,511,889 34,148,741 72,140,851 (17,437,644) 92,363,838
Depreciation charge for the year 0 1,301,561 480,736 928,304 0 2,710,601
Disposals 0 0 (257,130) (146,423) 0 (403,553)
Transfers 0 0 0 0 0 0
Reclassifications 0 0 0 0 0 0
Balance as at 31 December 2013 0 4,813,450 34,372,347 72,922,732 (17,437,644) 94,670,886
Carrying amount of owned property plant & equipment
Carrying Amount Land & Plant & Vehicles Furniture & Cohesion Total
buildings equipment fittings fund
As at 1 January 2012 40,000 18,443,468 1,396,128 3,889,436 1 23,769,033
As at 31 December 2012 40,000 17,102,377 1,559,546 2,521,602 1 21,223,527
As at 1 January 2013 40,000 17,102,377 1,559,546 2,521,602 1 21,223,525
As at 31 December 2013 40,000 15,824,113 1,644,404 3,264,204 1 20,772,721
39 of 58 Financial Statements as at 31 December 2013 (Amounts in Euros unless otherwise stated).