Page 83 - Annual Report 2013
P. 83
Annual Report 2013
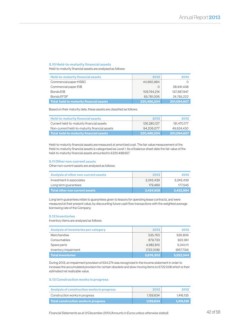
5.10 Held-to-maturity financial assets
Held-to-maturity financial assets are analysed as follows:
Held-to-maturity financial assets 2013 2012
Commercial paper HSBC 44,960,984 0
Commercial paper EIB 0 38,941,438
Bonds EIB 109,744,214 137,387,947
Bonds EFSF 65,781,006 24,765,222
Total held-to-maturity financial assets 220,486,204 201,094,607
Based on their maturity date, these assets are classified as follows:
Held-to-maturity financial assets 2013 2012
Current held-to-maturity financial assets 126,280,127 151,470,177
Non-current held-to-maturity financial assets 94,206,077 49,624,430
Total held-to-maturity financial assets 220,486,204 201,094,607
Held-to-maturity financial assets are measured at amortized cost. The fair value measurement of the
Held-to-maturity financial assets is categorised as Level 1. As of balance sheet date the fair value of the
held-to-maturity financial assets amounted to €220.498.657.
5.11 Other non-current assets
Other non-current assets are analysed as follows:
Analysis of other non-current assets 2013 2012
Investment in associates 3,245,439 3,245,439
Long term guarantees 179,489 177,545
Total other non current assets 3,424,928 3,422,984
Long term guarantees relate to guarantees given to lessors for operating lease contracts, and were
measured at their present value, by discounting future cash flow transactions with the weighted average
borrowing rate of the Company.
5.12 Inventories
Inventory items are analysed as follows:
Analysis of inventories per category 2013 2012
Merchandise 535,763 626,806
Consumables 879,733 922,361
Spare parts 4,982,815 5,041,111
Inventory impairment (722,008) (667,734)
Total inventories 5,676,303 5,922,544
During 2013, an impairment provision of €54.274 was recognized in the income statement in order to
increase the accumulated provision for certain obsolete and slow moving items to €722.008 which is their
estimated net realizable value.
5.13 Construction works in progress
Analysis of construction works in progress 2013 2012
Construction works in progress 1,159,634 1,416,135
Total construction works in progress 1,159,634 1,416,135
Financial Statements as at 31 December 2013 (Amounts in Euros unless otherwise stated). 42 of 58