Page 77 - Annual Report 2013
P. 77
Annual Report 2013
5 Notes to the financial statements
5.1 Revenues
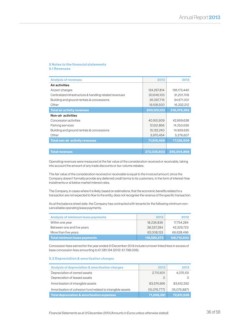
Analysis of revenues 2013 2012
Air activities
Airport charges 124,267,814 136,173,440
Centralized infrastructure & handling related revenues 30,646,103 31,201,709
Building and ground rentals & concessions 26,097,716 34,671,001
Other 19,108,500 16,332,212
Total air activity revenues 200,120,133 218,378,362
Non-air activities
Concession activities 40,160,909 42,669,638
Parking services 12,651,866 14,250,636
Building and ground rentals & concessions 15,132,240 14,929,625
Other 3,970,454 5,276,607
Total non-air activity revenues 71,915,469 77,126,506
Total revenues 272,035,603 295,504,868
Operating revenues were measured at the fair value of the consideration received or receivable, taking
into account the amount of any trade discounts or tax-volume rebates.
The fair value of the consideration received or receivable is equal to the invoiced amount, since the
Company doesn’t formally provide any deferred credit terms to its customers, in the form of interest-free
instalments or at below market interest rates.
The Company, in cases where it is likely, based on estimations, that the economic benefits related to a
transaction are not expected to flow to the entity, does not recognise the revenue of the specific transaction.
As at the balance sheet date, the Company has contracted with tenants for the following minimum non-
cancellable operating lease payments:
Analysis of minimum lease payments 2013 2012
Within one year 18,236,836 17,754,284
Between one and five years 38,337,284 42,329,723
More than five years 62,008,153 66,628,496
Total minimum lease payments 118,582,273 126,712,503
Concession fees earned for the year ended 31 December 2013 include turnover linked fees in excess of
base concession fees amounting to €1.581.134 (2012: €1.798.006).
5.2 Depreciation & amortisation charges
Analysis of depreciation & amortisation charges 2013 2012
Depreciation of owned assets 2,710,601 4,076,131
Depreciation of leased assets 0 0
Amortisation of intangible assets 83,574,566 83,612,292
Amortisation of cohesion fund related to intangible assets (15,076,777) (15,076,887)
Total depreciation & amortisation expenses 71,208,391 72,611,536
Financial Statements as at 31 December 2013 (Amounts in Euros unless otherwise stated). 36 of 58
5 Notes to the financial statements
5.1 Revenues
Analysis of revenues 2013 2012
Air activities
Airport charges 124,267,814 136,173,440
Centralized infrastructure & handling related revenues 30,646,103 31,201,709
Building and ground rentals & concessions 26,097,716 34,671,001
Other 19,108,500 16,332,212
Total air activity revenues 200,120,133 218,378,362
Non-air activities
Concession activities 40,160,909 42,669,638
Parking services 12,651,866 14,250,636
Building and ground rentals & concessions 15,132,240 14,929,625
Other 3,970,454 5,276,607
Total non-air activity revenues 71,915,469 77,126,506
Total revenues 272,035,603 295,504,868
Operating revenues were measured at the fair value of the consideration received or receivable, taking
into account the amount of any trade discounts or tax-volume rebates.
The fair value of the consideration received or receivable is equal to the invoiced amount, since the
Company doesn’t formally provide any deferred credit terms to its customers, in the form of interest-free
instalments or at below market interest rates.
The Company, in cases where it is likely, based on estimations, that the economic benefits related to a
transaction are not expected to flow to the entity, does not recognise the revenue of the specific transaction.
As at the balance sheet date, the Company has contracted with tenants for the following minimum non-
cancellable operating lease payments:
Analysis of minimum lease payments 2013 2012
Within one year 18,236,836 17,754,284
Between one and five years 38,337,284 42,329,723
More than five years 62,008,153 66,628,496
Total minimum lease payments 118,582,273 126,712,503
Concession fees earned for the year ended 31 December 2013 include turnover linked fees in excess of
base concession fees amounting to €1.581.134 (2012: €1.798.006).
5.2 Depreciation & amortisation charges
Analysis of depreciation & amortisation charges 2013 2012
Depreciation of owned assets 2,710,601 4,076,131
Depreciation of leased assets 0 0
Amortisation of intangible assets 83,574,566 83,612,292
Amortisation of cohesion fund related to intangible assets (15,076,777) (15,076,887)
Total depreciation & amortisation expenses 71,208,391 72,611,536
Financial Statements as at 31 December 2013 (Amounts in Euros unless otherwise stated). 36 of 58