Page 75 - Annual Report 2013
P. 75
Annual Report 2013
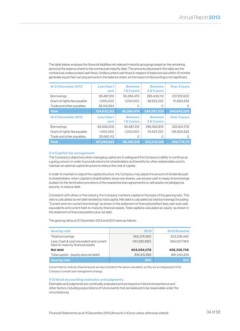
The table below analyses the financial liabilities into relevant maturity groupings based on the remaining
period at the balance sheet to the contractual maturity date. The amounts disclosed in the table are the
contractual undiscounted cash flows. Undiscounted cash flows in respect of balances due within 12 months
generally equal their carrying amounts in the balance sheet, as the impact of discounting is not significant.
At 31 December 2013 Less than 1 Between Between Over 5 years
year 1 & 2 years 2 & 5 years
Borrowings 95,487,319 95,284,479 285,435,113 237,812,602
Grant of rights fee payable 1,000,000 1,000,000 38,622,222 111,833,333
Trade and other payables 28,145,994 0 0 0
Total 124,633,313 96,284,479 324,057,335 349,645,935
At 31 December 2012 Less than 1 Between Between Over 5 years
year 1 & 2 years 2 & 5 years
Borrowings 95,636,509 95,487,319 285,590,816 332,941,378
Grant of rights fee payable 1,000,000 1,000,000 24,622,222 126,833,333
Trade and other payables 30,660,113 0 0 0
Total 127,296,622 96,487,319 310,213,038 459,774,711
3.2 Capital risk management
The Company’s objectives when managing capital are to safeguard the Company’s ability to continue as
a going concern in order to provide returns for shareholders and benefits for other stakeholders and to
maintain an optimal capital structure to reduce the cost of capital.
In order to maintain or adjust the capital structure, the Company may adjust the amount of dividends paid
to shareholders, return capital to shareholders, issue new shares, use excess cash to repay its borrowings
(subject to the termination provisions of the respective loan agreements) or sell assets not pledged as
security, to reduce debt.
Consistent with others in the industry, the Company monitors capital on the basis of the gearing ratio. This
ratio is calculated as net debt divided by total capital. Net debt is calculated as total borrowings (including
“Current and non-current borrowings” as shown in the statement of financial position) less cash and cash
equivalents and current held-to-maturity financial assets. Total capital is calculated as ‘equity’ as shown in
the statement of financial position plus net debt.
The gearing ratios at 31 December 2013 and 2012 were as follows:
Gearing ratio 2013 2012 Restated
Total borrowings 565,376,960 623,236,490
Less: Cash & cash equivalent and current (161,282,882) (165,007,784)
held-to-maturity financial assets
Net debt 404,094,078 458,228,706
Total capital – (equity plus net debt) 816,415,589 891,040,224
Gearing ratio 49% 51%
Current held-to-maturity financial assets are also included in the above calculation, as they are an integral part of the
Company’s overall cash management strategy.
4 Critical accounting estimates and judgments
Estimates and judgments are continually evaluated and are based on historical experience and
other factors, including expectations of future events that are believed to be reasonable under the
circumstances.
Financial Statements as at 31 December 2013 (Amounts in Euros unless otherwise stated). 34 of 58