Page 42 - Ath Airport Profile
P. 42
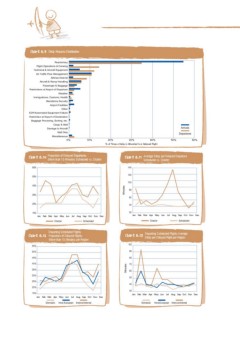
Chart 6.9 Delay Reasons Distribution
Reactionary Arrivals
Flight Operations & Crewing Departures
Technical & Aircraft Equipment
Air Traffic Flow Management 10% 20% 30% 40% 50% 60%
Airlines Internal
Aircraft & Ramp Handling
Passenger & Baggage
Restrictions at Airport of Departure
Weather
Immigrations, Customs, Health
Mandatory Security
Airport Facilities
Other
EDP/Automated Equipment Failure
Restriction at Airport of Destination
Baggage Procesing, Sorting, etc.
Cargo & Mail
Damage to Aircraft
Mail Only
Miscellaneous
0%
% of Times a Delay is Allocated to a Delayed Flight
Chart 6.10 Proportion of Delayed Departures Charter Chart 6.11 Average Delay per Delayed Departure
(More than 15 Minutes) Scheduled vs. Scheduled vs. Charter
65% 140
55% 120
100
45% Minutes
80
35% 60
25% 40
15% 20
Jan Feb Mar Apr May Jun Jul Aug Sep Oct Nov Dec Jan Feb Mar Apr May Jun Jul Aug Sep Oct Nov Dec
Charter Scheduled Charter Scheduled
Departing Scheduled Flights Chart 6.13 Departing Scheduled Flights Average
Delay per Delayed Flight per Region
Chart 6.12 Proportion of Delayed Flights
100
(More than 15 Minutes) per Region
90
55%
50% 80
45%
40% Minutes 70
35%
30% 60
25%
20% 50
15%
40
Jan Feb Mar Apr May Jun Jul Aug Sep Oct Nov Dec
Domestic Intra-European Intercontinental 30
Jan Feb Mar Apr May Jun Jul Aug Sep Oct Nov Dec
Domestic Intra-European Intercontinental