Page 41 - Ath Airport Profile
P. 41
Exercices on Punctuality 39
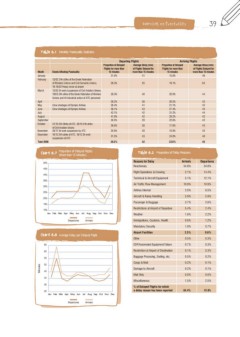
Table 6.1 Monthly Puntcuality Statistics
Departing Flights Arriving Flights
Proportion of Delayed Average Delay (min) Proportion of Delayed Average Delay (min)
Flights for more than of Flights Delayed for Flights for more than of Flights Delayed for
Month Events Affecting Punctuality 15 minutes more than 15 minutes 15 minutes more than 15 minutes
January
February 21.0% 41 15.8% 46
March 13/02 24h strike of the Greek Federation
April of Workers Unions and Civil Servants Unions. 26.3% 55 19.1% 64
May
June 16-18/02 Heavy snow at airport
July
August 12/03 3h work suspension of Civil Aviation Unions.
September
October 19/03 24h strike of the Greek Federation of Workers 26.3% 40 20.9% 44
November Unions and 4h industrial action of ATC personnel 20.5% 42
December 21.1% 42
26.2% 38 27.4% 45
Total 2008 31.2% 44
Crew shortages of Olympic Airlines 26.4% 41 29.2% 42
22.6% 42
Crew shortages of Olympic Airlines 36.1% 43
17.6% 43
42.1% 42
15.9% 43
41.9% 42
24.8% 48
30.5% 39
22.6% 45
21/10 24h Strike of ATC. 30/10 24h strike 26.8% 38
of Civil Aviation Unions 20.9% 39
26/11 3h work suspension by ATC
10/12 24h strike of ATC. 18/12 3h work 31.5% 43
suspension of ATC
30.3% 42
Chart 6.7 Proportion of Delayed Flights Table 6.2 Proportion of Delay Reasons
(More than 15 Minutes)
50% Reasons for Delay Arrivals Departures
45% Reactionary 54.8% 34.8%
40% Flight Operations & Crewing 2.1% 14.4%
35% Technical & Aircraft Equipment 5.1% 12.1%
30% Air Traffic Flow Management 10.8% 10.9%
25% Airlines Internal 2.0% 8.5%
20% Aircraft & Ramp Handling 5.9% 5.9%
15% Passenger & Baggage 3.7% 2.6%
10% Restrictions at Airport of Departure 5.4% 2.4%
Weather 1.6% 2.2%
Jan Feb Mar Apr May Jun Jul Aug Sep Oct Nov Dec Immigrations, Customs, Health 0.6% 1.2%
Mandatory Security 1.9% 0.7%
Departures Arrivals Airport Facilities 2.5% 0.6%
Other 0.5% 0.3%
Chart 6.8 Average Delay per Delayed Flight EDP/Automated Equipment Failure 0.7% 0.3%
Restriction at Airport of Destination 0.1% 0.3%
Minutes 65 Baggage Procesing, Sorting, etc. 0.5% 0.2%
60 Cargo & Mail 0.2% 0.1%
55 Damage to Aircraft 0.2% 0.1%
50 Mail Only 0.0% 0.0%
45 Miscellaneous 1.5% 2.5%
40 % of Delayed Flights for which
35 a delay reason has been reported 84.4% 91.6%
30
Jan Feb Mar Apr May Jun Jul Aug Sep Oct Nov Dec
Departures Arrivals