Page 48 - 2board23full
P. 48
Financial Statements
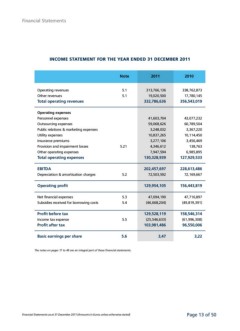
INCOME STATEMENT FOR THE YEAR ENDED 31 DECEMBER 2011
Note 2011 2010
Operating revenues 5.1 313,766,136 338,762,873
19,020,500 17,780,145
Other revenues 5.1
332,786,636 356,543,019
Total operating revenues
41,603,704 43,077,232
Operating expenses 59,068,626 60,789,504
Personnel expenses 3,248,032 3,367,220
10,837,265 10,114,450
Outsourcing expenses
3,277,106 3,456,469
Public relations & marketing expenses 4,346,612 138,763
7,947,594
Utility expenses 130,328,939 6,985,895
127,929,533
Insurance premiums 202,457,697
72,503,592 228,613,486
Provision and impairment losses 5.21 72,169,667
129,954,105
Other operating expenses 156,443,819
47,094,190
Total operating expenses (46,668,204) 47,716,897
(49,819,391)
EBITDA 129,528,119
(25,546,633) 158,546,314
Depreciation & amortisation charges 5.2 (61,996,308)
103,981,486 96,550,006
Operating profit
3,47 3,22
Net financial expenses 5.3
Subsidies received for borrowing costs 5.4
Profit before tax
Income tax expense 5.5
Profit after tax
Basic earnings per share 5.6
The notes on pages 17 to 49 are an integral part of these financial statements.
Financial Statements as at 31 December 2011 (Amounts in Euros unless otherwise stated) Page 13 of 50