Page 52 - 2board23full
P. 52
Financial Statements
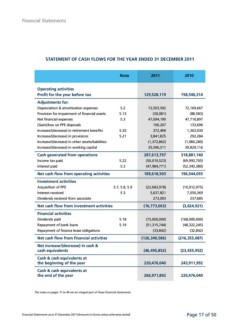
STATEMENT OF CASH FLOWS FOR THE YEAR ENDED 31 DECEMBER 2011
Note 2011 2010
Operating activities 158,546,314
Profit for the year before tax 129,528,119 72,169,667
(88,583)
Adjustments for: 72,503,592
(50,081) 47,716,897
Depreciation & amortisation expenses 5.2 133,696
47,094,190
Provision for impairment of financial assets 5.13 100,207 1,362,030
372,496 292,284
Net financial expenses 5.3
3,841,825 (1,080,280)
(Gain)/loss on PPE disposals (1,372,862) 39,829,116
35,596,311 318,881,140
Increase/(decrease) in retirement benefits 5.20 287,613,797 (69,993,705)
(50,010,523) (52,343,380)
Increase/(decrease) in provisions 5.21 (47,984,771) 196,544,055
189,618,503
Increase/(decrease) in other assets/liabilities (10,912,975)
(22,683,978) 7,050,369
Increase/(decrease) in working capital 5,637,821 237,685
273,093
Cash generated from operations (3,624,921)
(16,773,063)
Income tax paid 5.22 (168,000,000)
(75,000,000) (48,322,245)
Interest paid 5.3 (51,315,744) (32,842)
Net cash flow from operating activities (33,842) (216,355,087)
(126,349,586)
Investment activities (23,435,952)
(46,495,852)
Acquisition of PPE 5.7, 5.8, 5.9 243,911,992
220,476,040
Interest received 5.3 220,476,040
266,971,892
Dividends received from associate
Net cash flow from investment activities
Financial activities
Dividends paid 5.18
Repayment of bank loans 5.19
Repayment of finance lease obligations
Net cash flow from financial activities
Net increase/(decrease) in cash &
cash equivalents
Cash & cash equivalents at
the beginning of the year
Cash & cash equivalents at
the end of the year
The notes on pages 17 to 49 are an integral part of these financial statements.
Financial Statements as at 31 December 2011 (Amounts in Euros unless otherwise stated) Page 17 of 50