Page 50 - 2board23full
P. 50
Financial Statements
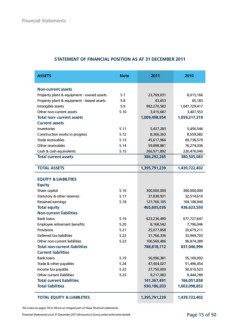
STATEMENT OF FINANCIAL POSITION AS AT 31 DECEMBER 2011
ASSETS Note 2011 2010
Non-current assets 23,769,031 8,015,166
43,653 65,183
Property plant & equipment - owned assets 5.7
982,270,583 1,047,729,417
Property plant & equipment - leased assets 5.8 3,415,687 3,407,553
Intangible assets 5.9 1,009,498,954 1,059,217,319
Other non-current assets 5.10 5,437,283 5,456,546
8,366,263 8,559,582
Total non- current assets 45,617,966 69,738,579
59,898,881 76,274,336
Current assets 266,971,892 220,476,040
386,292,285 380,505,083
Inventories 5.11
1,395,791,239 1,439,722,402
Construction works in progress 5.12
300,000,000 300,000,000
Trade receivables 5.13 37,838,931 32,514,610
Other receivables 5.14 127,766,105 104,108,940
465,605,036 436,623,550
Cash & cash equivalents 5.15
623,236,490 677,727,647
Total current assets 8,168,542 7,796,046
TOTAL ASSETS 25,077,858 20,679,211
31,766,336 33,969,703
EQUITY & LIABILITIES 100,569,486 96,874,389
788,818,712 837,046,996
Equity
56,996,381 55,100,092
Share capital 5.16 47,404,027 51,496,454
27,750,000 50,010,523
Statutory & other reserves 5.17
9,217,083 9,444,789
Retained earnings 5.18 141,367,491 166,051,858
930,186,203 1,003,098,852
Total equity
1,395,791,239 1,439,722,402
Non-current liabilities
Page 15 of 50
Bank loans 5.19
Employee retirement benefits 5.20
Provisions 5.21
Deferred tax liabilities 5.22
Other non-current liabilities 5.23
Total non-current liabilities
Current liabilities
Bank loans 5.19
Trade & other payables 5.24
Income tax payable 5.22
Other current liabilities 5.25
Total current liabilities
Total liabilities
TOTAL EQUITY & LIABILITIES
The notes on pages 18 to 49 are an integral part of these financial statements.
Financial Statements as at 31 December 2011 (Amounts in Euros unless otherwise stated)