Page 28 - Annual_Report_2016
P. 28
4 Financial Performance aia.gr
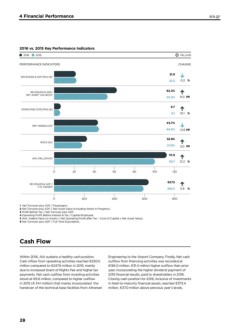
2016 vs. 2015 Key Performance Indicators
2016 2015 € MILLION
CHANGE
PERFORMANCE INDICATORS
REVENUES & ADF/PAX (€)1 21.6
22.3
-3.2 %
REVENUES & ADF/ 62.2% 9.0 pp
NET ASSET VALUE(%)2 53.2%
OPERATING COST/PAX (€) 6.7
6.1 10.1 %
PBT MARGIN (%)3 43.7%
44.6%
-0.8 pp
ROCE (%)4 32.8%
27.8%
5.0 pp
AVA (MILLION €)5 111.9 12.2 %
99.7
0 20 40 60 80 100
120
REVENUES & ADF /
FTE (‘000€)6 627.5 5.9 %
592.5
0 200 400 600
1 Net Turnover plus ADF / Passengers. 800
2 Net Turnover plus ADF / Net Asset Value (including Works In Progress).
3 Profit Before Tax / Net Turnover plus ADF.
4 Operating Profit Before Interest & Tax / Capital Employed.
5 AVA: Added Value on Assets = Net Operating Profit after Tax – (Cost of Capital x Net Asset Value).
6 Net Turnover plus ADF / Full Time Equivalents.
Cash Flow
Within 2016, AIA sustains a healthy cash position. Engineering to the Airport Company. Finally, Net cash
Cash inflow from operating activities reached €230.5 outflow from financing activities was recorded at
million compared to €247.6 million in 2015, mainly €184.0 million, €31.4 million higher outflow than prior
due to increased Grant of Rights Fee and higher tax year, incorporating the higher dividend payment of
payments. Net cash outflow from investing activities 2015 financial results, paid to shareholders in 2016.
stood at €9.6 million, compared to higher outflow Closing cash position for 2016, inclusive of investments
in 2015 (€ 34.1 million) that mainly incorporated the in held-to-maturity financial assets, reached €373.4
handover of the technical base facilities from Athenian million, €37.0 million above previous year’s levels.
28