Page 17 - Annual_Report_2016
P. 17
aia.gr Annual Report 2016
The aforementioned results are attributed to the residents grew even more impressively (+15%), largely
dynamic expansion of the international route network supported by competitive air ticket prices.
of the airport’s home base carriers and the successful
performance of Greek and foreign visiting carriers, As a result of all the above, airport’s traffic reached
combined with strong passenger demand dynamics. 20.02 million passengers in 2016 exceeding prior-
More specifically, despite the generally volatile market year levels by 1.9 million, a significant increase of
environment and the initial unfavourable indications 10.7%, whereas flights amounted to 189.1 thousand
for incoming tourism, traffic dynamics of the second surpassing the respective 2015 levels by 7.4%.
half of the year were strong for both international
and domestic tourism, in line with the global industry During 2016, three new airlines and ten new routes
trends. In the case of Athens and Greece this positive were added to the airport’s network, while 18 LCCs
outcome could partly be attributed to holiday makers offered services to 59 cities worldwide. Athens was
lately shifting from previously popular destinations directly connected with scheduled services with
facing turmoil to safer ones. Overall, foreign residents 125 destinations (92 of which international) in 48
demonstrated a rise of 8% during 2016 while Greek countries, operated by a total of 60 carriers.
Traffic Development of A/C Movements 2015-2016
2016 2015 MOVEMENTS
DOMESTIC
79,528 6.4%
74,740
INTERNATIONAL
109,609 8.1%
101,416
TOTAL
189,137 7.4%
176,156
0 50,000 100,000 150,000
200,000
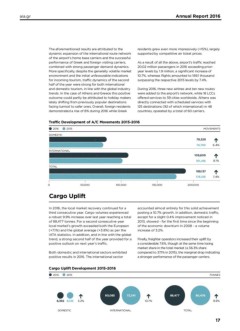
Cargo Uplift
In 2016, the local market recovery continued for a accounted almost entirely for this solid achievement
third consecutive year. Cargo volumes experienced posting a 10.7% growth. In addition, domestic traffic,
a robust 9.9% increase over last year reaching a total except for a slight 0.4% improvement noticed in
of 88,477 tonnes. For a second consecutive year 2013, showed - for the first time since the beginning
local market’s growth exceeded both the European of the economic downturn in 2008 - a volume
(+7.1%) and the global average (+3.8%) as per the increase of 3.2%.
IATA statistics. In addition, and in line with the global
trend, a strong second half of the year provided for a Finally, freighter operators increased their uplift by
positive outlook on next year’s traffic. a considerable 7.6%, though at the same time losing
market share in the total market (a 36.3% share
Both domestic and international sectors exhibited compared to 37.1% in 2015), the marginal drop indicating
positive results in 2016. The international sector a stronger performance of the passenger carriers.
Cargo Uplift Development 2015-2016
2016 2015 TONNES
80,085 72,341 88,477 80,476
8,392 8,135 3.2% 10.7% 9.9%
DOMESTIC
INTERNATIONAL TOTAL 17
The aforementioned results are attributed to the residents grew even more impressively (+15%), largely
dynamic expansion of the international route network supported by competitive air ticket prices.
of the airport’s home base carriers and the successful
performance of Greek and foreign visiting carriers, As a result of all the above, airport’s traffic reached
combined with strong passenger demand dynamics. 20.02 million passengers in 2016 exceeding prior-
More specifically, despite the generally volatile market year levels by 1.9 million, a significant increase of
environment and the initial unfavourable indications 10.7%, whereas flights amounted to 189.1 thousand
for incoming tourism, traffic dynamics of the second surpassing the respective 2015 levels by 7.4%.
half of the year were strong for both international
and domestic tourism, in line with the global industry During 2016, three new airlines and ten new routes
trends. In the case of Athens and Greece this positive were added to the airport’s network, while 18 LCCs
outcome could partly be attributed to holiday makers offered services to 59 cities worldwide. Athens was
lately shifting from previously popular destinations directly connected with scheduled services with
facing turmoil to safer ones. Overall, foreign residents 125 destinations (92 of which international) in 48
demonstrated a rise of 8% during 2016 while Greek countries, operated by a total of 60 carriers.
Traffic Development of A/C Movements 2015-2016
2016 2015 MOVEMENTS
DOMESTIC
79,528 6.4%
74,740
INTERNATIONAL
109,609 8.1%
101,416
TOTAL
189,137 7.4%
176,156
0 50,000 100,000 150,000
200,000
Cargo Uplift
In 2016, the local market recovery continued for a accounted almost entirely for this solid achievement
third consecutive year. Cargo volumes experienced posting a 10.7% growth. In addition, domestic traffic,
a robust 9.9% increase over last year reaching a total except for a slight 0.4% improvement noticed in
of 88,477 tonnes. For a second consecutive year 2013, showed - for the first time since the beginning
local market’s growth exceeded both the European of the economic downturn in 2008 - a volume
(+7.1%) and the global average (+3.8%) as per the increase of 3.2%.
IATA statistics. In addition, and in line with the global
trend, a strong second half of the year provided for a Finally, freighter operators increased their uplift by
positive outlook on next year’s traffic. a considerable 7.6%, though at the same time losing
market share in the total market (a 36.3% share
Both domestic and international sectors exhibited compared to 37.1% in 2015), the marginal drop indicating
positive results in 2016. The international sector a stronger performance of the passenger carriers.
Cargo Uplift Development 2015-2016
2016 2015 TONNES
80,085 72,341 88,477 80,476
8,392 8,135 3.2% 10.7% 9.9%
DOMESTIC
INTERNATIONAL TOTAL 17