Page 18 - Ath Airport Profile
P. 18
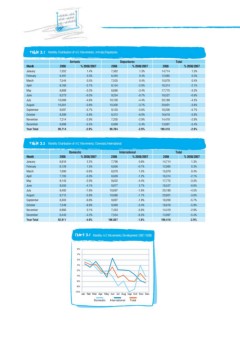
Table 3.1 Monthly Distribution of A/C Movements: Arrivals/Departures
Month 2008 Arrivals Departures 2008 Total
January 7,352 % 2008/2007 2008 % 2008/2007 14,714 % 2008/2007
February 6,491 1.4% 12,985 1.3%
March 7,544 0.3% 7,362 1.3% 15,079 0.3%
April 8,160 0.5% 16,314 0.4%
May 8,889 -2.1% 6,494 0.4% 17,775 -2.1%
June 9,273 -3.3% 18,527 -3.3%
July 10,089 -0.5% 7,535 0.4% 20,189 -0.6%
August 10,301 -4.6% 20,601 -4.5%
September 9,097 -3.6% 8,154 -2.0% 18,200 -3.6%
October 8,306 -5.7% 16,618 -5.7%
November 7,214 -5.8% 8,886 -3.4% 14,419 -5.9%
December 6,998 -2.9% 13,997 -2.9%
Year Total 99,714 -5.5% 9,254 -0.7% 199,418 -5.4%
-2.9% -2.9%
10,100 -4.4%
10,300 -3.7%
9,103 -5.6%
8,312 -6.0%
7,205 -2.9%
6,999 -5.4%
99,704 -2.9%
Table 3.2 Monthly Distribution of A/C Movements: Domestic/International
Month 2008 Domestic International 2008 Total
January 6,916 % 2008/2007 2008 % 2008/2007 14,714 % 2008/2007
February 6,129 2.2% 12,985 1.3%
March 7,000 1.5% 7,798 0.6% 15,079 0.3%
April 7,705 -0.8% 16,314 0.4%
May 8,143 -3.0% 6,856 -0.7% 17,775 -2.1%
June 8,550 -2.0% 18,527 -3.3%
July 9,492 -4.1% 8,079 1.5% 20,189 -0.6%
August 9,715 -7.6% 20,601 -4.5%
September 8,303 -5.8% 8,609 -1.2% 18,200 -3.6%
October 7,549 -9.8% 16,618 -5.7%
November 6,966 -8.8% 9,632 -4.4% 14,419 -5.9%
December 6,443 0.1% 13,997 -2.9%
Year Total 92,911 -4.2% 9,977 2.7% 199,418 -5.4%
-4.0% -2.9%
10,697 -1.6%
10,886 -1.7%
9,897 -1.9%
9,069 -3.4%
7,453 -5.6%
7,554 -6.5%
106,507 -1.8%
Chart 3.1 Monthly A/C Movements Development 2007-2008
6%
4%
2%
0%
-2%
-4%
-6%
-8%
-10%
Jan Feb Mar Apr May Jun Jul Aug Sep Oct Nov Dec
Domestic International Total