Page 15 - Ath Airport Profile
P. 15
How Many Travelled Where 13
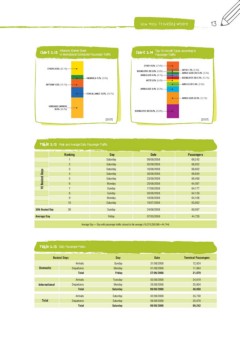
Chart 2.13 Alliances Market Share Chart 2.14 Top 10 Aircraft Types according to
in International Scheduled Passenger Traffic Passenger Traffic
OTHERS 24.6% [23.1%] ONEWORLD 7.2% [7.5%] OTHER 14.5% [17.6%] ART42 1.7% [2.2%]
STAR ALLIANCE 18.0% [18.1%] BOEING B767-300 2.8% [2.8%] AIRBUS A340-300 3.4% [3.3%]
SKYTEAM 14.2% [16.1%] BOEING B737-300 4.7% [12.1%]
[2007] AIRBUS A319 4.4% [4.1%] AVRO RJ100 7.9% [7.5%]
HOMEBASE CARRIERS ART72 5.0% [5.4%]
36.0% [35.2%] AIRBUS A320 22.0% [13.1%]
AIRBUS A321 9.4% [8.2%]
BOEING B737-400 24.4% [23.8%]
[2007]
Table 2.12 Peak and Average Daily Passenger Traffic
10 Busiest Days Ranking Day Date Passengers
1 Saturday 09/08/2008 69,242
30th Busiest Day 2 Saturday 02/08/2008 68,952
Average Day 3 Saturday 16/08/2008 66,602
4 Saturday 30/08/2008 66,600
5 Saturday 23/08/2008 66,468
6 Monday 25/08/2008 64,597
7 Sunday 17/08/2008 64,177
8 Sunday 03/08/2008 64,158
9 Monday 18/08/2008 64,106
10 Saturday 19/07/2008 63,962
30 Sunday 24/08/2008 60,097
Friday 07/03/2008 44,728
Average Day = Day with passenger traffic closest to the average (16,376,250/366=44,744)
Table 2.13 Daily Passenger Peaks
Busiest Days Day Date Terminal Passengers
Sunday 31/08/2008 12,924
Domestic Arrivals Monday 01/08/2008 11,984
Departures Friday 27/06/2008 21,879
Total Tuesday 02/08/2008 24,619
Monday 25/08/2008 25,804
International Arrivals Saturday 09/08/2008 48,058
Departures
Saturday 02/08/2008 33,730
Total Saturday 09/08/2008 35,678
Saturday 09/08/2008 69,242
Total Arrivals
Departures
Total