Page 57 - Annual Report 2013
P. 57
Annual Report 2013
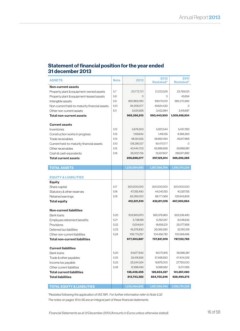
Statement of financial position for the year ended
31 december 2013
2012
2011
ASSETS Note 2013 Restated* Restated*
Non-current assets
Property plant & equipment-owned assets 5.7 20,772,721 21,223,526 23,769,031
Property plant & equipment-leased assets 5.8 0 0 43,654
Intangible assets 5.9 850,963,090 916,170,010 982,270,582
Non-current held-to-maturity financial assets 5.10 94,206,077 49,624,430 0
Other non-current assets 5.11 3,424,928 3,422,984 3,415,687
Total non-current assets 969,366,815 990,440,950 1,009,498,954
Current assets
Inventories 5.12 5,676,303 5,922,544 5,437,283
Construction works in progress 5.13 1,159,634 1,416,135 8,366,263
Trade receivables 5.14 48,134,555 58,892,494 45,617,966
Current held-to-maturity financial assets 5.10 126,280,127 151,470,177 0
Other receivables 5.15 40,444,703 65,886,858 59,898,881
Cash & cash equivalents 5.16 35,002,755 13,537,607 266,971,892
Total current assets 256,698,077 297,125,814 386,292,285
TOTAL ASSETS 1,226,064,892 1,287,566,764 1,395,791,239
EQUITY & LIABILITIES
Equity
Share capital 5.17 300,000,000 300,000,000 300,000,000
Statutory & other reserves 5.18 47,055,490 44,040,150 40,357,155
Retained earnings 5.19 65,266,020 88,771,368 126,943,809
Total equity 412,321,510 432,811,518 467,300,964
Non-current liabilities
Bank loans 5.20 503,900,970 565,376,960 623,236,490
Employee retirement benefits 5.21 5,738,189 6,262,557 6,048,633
Provisions 5.22 13,514,641 18,659,231 25,077,858
Deferred tax liabilities 5.23 45,376,830 33,066,390 32,190,318
Other non-current liabilities 5.24 108,773,257 104,456,782 100,569,486
Total non-current liabilities 677,303,887 727,821,919 787,122,785
Current liabilities
Bank loans 5.20 64,677,842 60,170,815 56,996,381
Trade & other payables 5.25 33,418,836 37,488,930 47,404,026
Income tax payable 5.23 25,344,324 19,875,000 27,750,000
Other current liabilities 5.26 12,998,493 9,398,582 9,217,083
Total current liabilities 136,439,495 126,933,327 141,367,490
Total liabilities 813,743,382 854,755,246 928,490,275
TOTAL EQUITY & LIABILITIES 1,226,064,892 1,287,566,764 1,395,791,239
*Restated following the application of IAS 19R . For further information refer to Note 5.32
The notes on pages 19 to 56 are an integral part of these financial statements.
Financial Statements as at 31 December 2013 (Amounts in Euros unless otherwise stated). 16 of 58