Page 72 - 2board23full
P. 72
Financial Statements
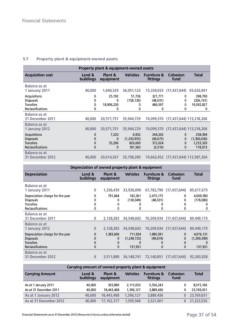
5.7 Property plant & equipment-owned assets
Property plant & equipment-owned assets
Acquisition cost Land & Plant & Vehicles Furniture & Cohesion Total
buildings equipment fittings fund
Balance as at 40,000 1,640,329 36,051,123 73,339,033 (17,437,644) 93,632,841
1 January 2011
0 25,192 51,736 321,771 0 398,700
Acquisitions 0 0 (158,130) (48,031) 0 (206,161)
Disposals 0 486,597 0 19,392,827
Transfers 0 18,906,230 0 0 0
Reclassifications 0 0 0
Balance as at 40,000 20,571,751 35,944,729 74,099,370 (17,437,644) 113,218,206
31 December 2011
40,000 20,571,751 35,944,729 74,099,370 (17,437,644) 113,218,206
Balance as at
1 January 2012 0 7,220 6,932 244,242 0 258,394
0 0 (1,250,955) (49,675) 0 (1,300,630)
Acquisitions 0 372,024 0 1,233,320
Disposals 0 35,296 826,000 (3,510) 0 178,073
Transfers 0 181,583
Reclassifications
40,000 20,614,267 35,708,289 74,662,452 (17,437,644) 113,587,364
Balance as at
31 December 2012
Depreciation of owned property plant & equipment
Depreciation Land & Plant & Vehicles Furniture & Cohesion Total
buildings equipment fittings fund
Balance as at 0 1,336,439 33,936,090 67,782,790 (17,437,644) 85,617,675
1 January 2011
0 791,844 742,561 2,475,175 0 4,009,580
Depreciation charge for the year 0 (178,080)
Disposals 0 0 (130,049) (48,031) 0 0
Transfers 0 0
Reclassifications 0 0 0 0
Balance as at 0 0 0 0
31 December 2011
0 2,128,283 34,548,602 70,209,934 (17,437,644) 89,449,175
Balance as at
1 January 2012 0 2,128,283 34,548,602 70,209,934 (17,437,644) 89,449,175
Depreciation charge for the year 0 1,383,606 711,934 1,980,591 0 4,076,131
Disposals 0 (1,299,399)
Transfers 0 0 (1,249,725) (49,674) 0 0
Reclassifications 0 137,931
0 0 0 0
Balance as at
31 December 2012 0 0 137,931 0
0 3,511,889 34,148,741 72,140,851 (17,437,644) 92,363,838
Carrying amount of owned property plant & equipment
Carrying Amount Land & Plant & Vehicles Furniture & Cohesion Total
buildings equipment fittings fund
As at 1 January 2011 40,000 303,890 2,115,033 5,556,243 0 8,015,166
As at 31 December 2011 40,000 18,443,468 1,396,127 3,889,436 0 23,769,031
As at 1 January 2012 40,000 18,443,468 1,396,127 3,889,436 0 23,769,031
As at 31 December 2012 40,000 17,102,377 1,559,548 2,521,601 0 21,223,526
Financial Statements as at 31 December 2012 (Amounts in Euros unless otherwise stated) Page 37 of 54