Page 67 - 2board23full
P. 67
2011
5 Notes to the financial statements
5.1 Operating revenues
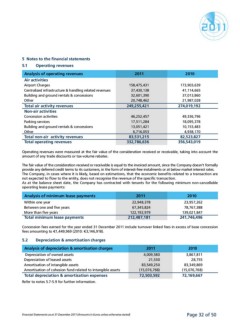
Analysis of operating revenues 2011 2010
Air activities 173,903,639
41,114,665
Airport Charges 158,475,431 37,013,860
21,987,028
Centralized infrastructure & handling related revenues 37,430,138
274,019,192
Building and ground rentals & concessions 32,601,390
49,336,796
Other 20,748,462 18,095,378
10,153,483
Total air activity revenues 249,255,421
4,938,170
Non-air activities 82,523,827
356,543,019
Concession activities 46,252,457
Parking services 17,511,284
Building and ground rentals & concessions 13,051,421
Other 6,716,053
Total non-air activity revenues 83,531,215
Total operating revenues 332,786,636
Operating revenues were measured at the fair value of the consideration received or receivable, taking into account the
amount of any trade discounts or tax-volume rebates.
The fair value of the consideration received or receivable is equal to the invoiced amount, since the Company doesn’t formally
provide any deferred credit terms to its customers, in the form of interest-free instalments or at below market interest rates.
The Company, in cases where it is likely, based on estimations, that the economic benefits related to a transaction are
not expected to flow to the entity, does not recognise the revenue of the specific transaction.
As at the balance sheet date, the Company has contracted with tenants for the following minimum non-cancellable
operating lease payments:
Analysis of minimum lease payments 2011 2010
Within one year 22,948,378 23,957,262
Between one and five years 67,345,824 78,767,388
More than five years 122,192,979 139,021,847
Total minimum lease payments 212,487,181 241,746,496
Concession fees earned for the year ended 31 December 2011 include turnover linked fees in excess of base concession
fees amounting to €1,449,969 (2010: €3,146,918).
5.2 Depreciation & amortisation charges 2011 2010
Analysis of depreciation & amortisation charges 4,009,580 3,867,811
21,530 28,755
Depreciation of owned assets
Depreciation of leased assets 83,549,250 83,349,869
Amortisation of intangible assets (15,076,768) (15,076,768)
Amortisation of cohesion fund related to intangible assets
72,503,592 72,169,667
Total depreciation & amortisation expenses
Refer to notes 5.7-5.9 for further information.
Financial Statements as at 31 December 2011 (Amounts in Euros unless otherwise stated) Page 32 of 50
5 Notes to the financial statements
5.1 Operating revenues
Analysis of operating revenues 2011 2010
Air activities 173,903,639
41,114,665
Airport Charges 158,475,431 37,013,860
21,987,028
Centralized infrastructure & handling related revenues 37,430,138
274,019,192
Building and ground rentals & concessions 32,601,390
49,336,796
Other 20,748,462 18,095,378
10,153,483
Total air activity revenues 249,255,421
4,938,170
Non-air activities 82,523,827
356,543,019
Concession activities 46,252,457
Parking services 17,511,284
Building and ground rentals & concessions 13,051,421
Other 6,716,053
Total non-air activity revenues 83,531,215
Total operating revenues 332,786,636
Operating revenues were measured at the fair value of the consideration received or receivable, taking into account the
amount of any trade discounts or tax-volume rebates.
The fair value of the consideration received or receivable is equal to the invoiced amount, since the Company doesn’t formally
provide any deferred credit terms to its customers, in the form of interest-free instalments or at below market interest rates.
The Company, in cases where it is likely, based on estimations, that the economic benefits related to a transaction are
not expected to flow to the entity, does not recognise the revenue of the specific transaction.
As at the balance sheet date, the Company has contracted with tenants for the following minimum non-cancellable
operating lease payments:
Analysis of minimum lease payments 2011 2010
Within one year 22,948,378 23,957,262
Between one and five years 67,345,824 78,767,388
More than five years 122,192,979 139,021,847
Total minimum lease payments 212,487,181 241,746,496
Concession fees earned for the year ended 31 December 2011 include turnover linked fees in excess of base concession
fees amounting to €1,449,969 (2010: €3,146,918).
5.2 Depreciation & amortisation charges 2011 2010
Analysis of depreciation & amortisation charges 4,009,580 3,867,811
21,530 28,755
Depreciation of owned assets
Depreciation of leased assets 83,549,250 83,349,869
Amortisation of intangible assets (15,076,768) (15,076,768)
Amortisation of cohesion fund related to intangible assets
72,503,592 72,169,667
Total depreciation & amortisation expenses
Refer to notes 5.7-5.9 for further information.
Financial Statements as at 31 December 2011 (Amounts in Euros unless otherwise stated) Page 32 of 50