Page 15 - 2board23full
P. 15
03. MARKET OVERVIEW
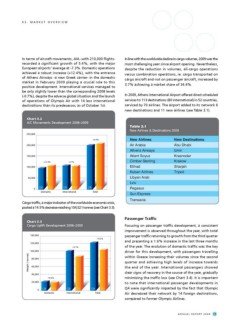
In terms of aircraft movements, AIA -with 210,000 flights- In line with the worldwide decline in cargo volumes, 2009 was the
recorded a significant growth of 5.4%, with the major most challenging year since airport opening. Nevertheless,
European airports’ average at -7.3%. Domestic operations despite the reduction in volumes, all-cargo operations
achieved a robust increase (+12.4%), with the entrance versus combination operations, ie. cargo transported on
of Athens Airways -a new Greek carrier- in the domestic cargo aircraft and not on passenger aircraft, increased by
market in February 2009 playing a crucial role to this 3.7% achieving a market share of 34.4%.
positive development. International services managed to
be only slightly lower than the corresponding 2008 levels In 2009, Athens International Airport offered direct scheduled
(-0.7%), despite the adverse global situation and the launch services to 113 destinations (80 international) in 52 countries,
of operations of Olympic Air with 14 less international serviced by 70 airlines. The airport added to its network 6
destinations than its predecessor, as of October 1st. new destinations and 11 new airlines (see Table 3.1).
Chart 3.2 Table 3.1
A/C Movements Development 2008–2009 New Airlines & Destinations 2009
250,000 +5.4% New Airlines New Destinations
200,000 Air Arabia Abu Dhabi
Athens Airways Izmir
150,000 +12.4% -0.7% Atlant Soyuz Krasnodar
100,000 Cimber Sterling Krakow
Etihad Sharjah
Kuban Airlines Tripoli
Libyan Arab
50,000 08 09 08 09 Lviv
Pegasus
0 08 09 International Total Sun Express
Domestic Transavia
Cargo traffic, a major indicator of the worldwide economic crisis,
posted a 14.5% decrease reaching 104,521 tonnes (see Chart 3.3).
Chart 3.3 Passenger Traffic
Cargo Uplift Development 2008–2009
Focusing on passenger traffic development, a consistent
140,000 improvement is observed throughout the year, with total
passenger traffic returning to growth from the third quarter
120,000 -14.5% and presenting a 1.6% increase in the last three months
of the year. The evolution of domestic traffic was the key
100,000 -13.7% 08 09 driver for this development, with passengers travelling
within Greece increasing their volumes since the second
Weight ( tonnes) 80,000 08 09 Total quarter and achieving high levels of increase towards
the end of the year. International passengers showed
60,000 International clear signs of recovery in the course of the year, gradually
minimizing the traffic loss (see Chart 3.4). It is important
40,000 -18.0% to note that international passenger developments in
20,000 Q4 were significantly impacted by the fact that Olympic
Air decreased their network by 14 foreign destinations,
0 08 09 compared to former Olympic Airlines.
Domestic
A N N U A L R E P O R T 2 0 0 9 13