Page 154 - teyxos_13
P. 154
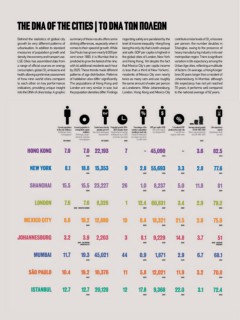
ΤΗΕ DNA OF THE CITIES | ΤΟ DNA ΤΩΝ ΠΟΛΕΩΝ
Behind the statistics of global city summary of these results offers some regarding safety are paralleled by the contribute similar levels of CO2 emissions
growth lie very different patterns of striking differences, especially when it level of income inequality -Hong Kong per person, the number doubles in
urbanisation. In addition to standard comes to their speed of growth. While being the only city that is both unequal Shanghai, owing to the presence of
measures of population growth and Sao Paulo has grown nearly 8,000 per and safe. GDP per capita is highest in heavy manufacturing industry in its vast
density, the economy and transport use, cent since 1900, it is Mumbai that is the global cities of London, New York metropolitan region. There is significant
LSE Cities has assembled data from predicted to grow the fastest of the nine, and Hong Kong. Yet despite the fact variation in life expectancy among the
a range of official sources on energy with 44 additional residents each hour that Mexico City’s per capita income Urban Age cities, reflecting a multitude
consumption, global CO2 emissions and by 2025. These trends mask different is less than a third of New Yorkers’, of factors. On average, a Hong Konger
health, allowing a preliminary assessment patterns of age distribution. Patterns residents of Mexico City own nearly lives 30 years longer than a resident of
of how nine world cities compare of habitation also differ significantly. twice as many cars and use roughly Johannesburg. In Mumbai, although
to each other on key performance The populations of Hong Kong and the same amount of water per person life expectancy has not yet reached
indicators, providing unique insight London are very similar in size, but as Londoners. While Johannesburg, 70 years, it performs well compared
into the DNA of cities today. A graphic the population densities differ. Findings London, Hong Kong and Mexico City to the national average of 62 years.
Current population Current population in Central area density Projected growth 2010- Percentage of the GDP per capita (US$) % of national GDP Average annual growth Life expectancy
in the city (millions) metropolitan region (people per km²) 2025 (people /hour) country’s population ΑΕΠ κατά κεφαλή produced by each city of GVA 1993-2010 (years)
residing in each city (σε δολάρια ΗΠΑ)
Πληθυσμός πόλης (millions) Πυκνότητα πληθυσμού Προβλεπόμενη αύξηση Ποσοστό πληθυσμού % του ΑΕΠ που Μέση ετήσια ανάπτυξη Προσδόκιμο ζωής
(εκατομμύρια) Πληθυσμός μητρο- (κάτοικοι/km2) πληθυσμού ώς το 2025 της χώρας που μένει παράγει κάθε πόλη του GVA 1993-2010 (σε έτη)
πολιτικής περιοχής (γεννήσεις ανά ώρα)
σε κάθε πόλη
(εκατομμύρια)
154