Page 60 - Annual Report 2015 EN
P. 60
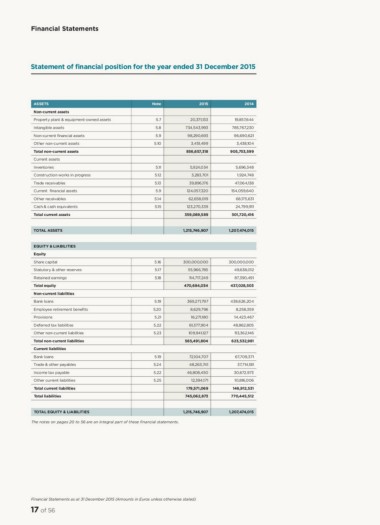
Financial Statements
Statement of nancial position for the year ended 31 December 2015
ASSETS Note 2015 2014
Non-current assets
Property plant & equipment-owned assets 5.7 20,371,133 19,857,644
Intangible assets 5.8 734,543,993 785,767,230
Non-current nancial assets 5.9
Other non-current assets 5.10 98,290,693 96,690,621
Total non-current assets 3,451,499 3,438,104
Current assets 5.11
Inventories 5.12 856,657,318 905,753,599
Construction works in progress 5.13
Trade receivables 5.9 5,924,034 5,696,348
Current nancial assets 5.14 3,283,701 1,924,748
Other receivables 5.15 39,896,176 47,064,138
Cash & cash equivalents 124,057,320 154,059,640
Total current assets 62,658,019 68,175,631
123,270,339 24,799,911
359,089,589 301,720,416
TOTAL ASSETS 1,215,746,907 1,207,474,015
EQUITY & LIABILITIES 5.16 300,000,000 300,000,000
Equity 5.17 55,966,785 49,638,012
Share capital 5.18 114,717,249 87,390,491
Statutory & other reserves
Retained earnings 5.19 470,684,034 437,028,503
Total equity 5.20
Non-current liabilities 5.21 369,271,797 438,626,204
Bank loans 5.22 8,629,796 8,258,359
Employee retirement bene ts 5.23 16,271,180 14,423,467
Provisions 61,377,904
Deferred tax liabilities 5.19 109,941,127 48,862,805
Other non-current liabilities 5.24 113,362,146
Total non-current liabilities 5.22 565,491,804 623,532,981
Current liabilities 5.25
Bank loans 72,104,707 67,709,371
Trade & other payables 48,263,741 37,714,181
Income tax payable 46,808,450
Other current liabilities 12,394,171 30,672,973
Total current liabilities 179,571,069 10,816,006
Total liabilities 745,062,873 146,912,531
770,445,512
TOTAL EQUITY & LIABILITIES 1,215,746,907
1,207,474,015
The notes on pages 20 to 56 are an integral part of these nancial statements.
Financial Statements as at 31 December 2015 (Amounts in Euros unless otherwise stated)
17 of 56