Page 70 - AEROSTAT 2023
P. 70
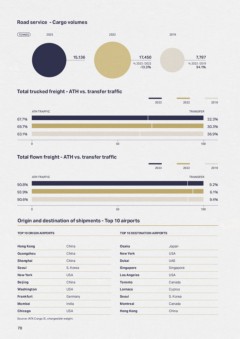
Road service - Cargo volumes
TONNES 2023 2022 2019
15,136 17,450 7,797
% 2023 /2022 % 2023 /2019
-13.3% 94.1%
Total trucked freight - ATH vs. transfer traic
2023 2022 2019
ATH TRAFFIC TRANSFER
67.7% 32.3%
69.7% 30.3%
63.1% 36.9%
0 50 100
Total lown freight - ATH vs. transfer traic
2023 2022 2019
ATH TRAFFIC TRANSFER
90.8% 9.2%
93.9% 6.1%
90.6% 9.4%
0 50 100
Origin and destination of shipments - Top 10 airports
TOP 10 ORIGIN AIRPORTS TOP 10 DESTINATION AIRPORTS
Hong Kong China Osaka Japan
Guangzhou China New York USA
Shanghai China Dubai UAE
Seoul S. Korea Singapore Singapore
New York USA Los Angeles USA
Beijing China Toronto Canada
Washington USA Larnaca Cyprus
Frankfurt Germany Seoul S. Korea
Mumbai India Montreal Canada
Chicago USA Hong Kong China
Source: IATA Cargo IS, chargeable weight.
70 71