Page 53 - 2board23full
P. 53
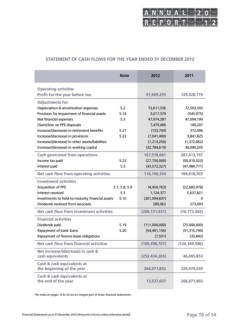
STATEMENT OF CASH FLOWS FOR THE YEAR ENDED 31 DECEMBER 2012
Note 2012 2011
Operating activities 129,528,119
Profit for the year before tax 97,609,255 72,503,592
(543,975)
Adjustments for: 72,611,536
3,017,579 47,094,190
Depreciation & amortisation expenses 5.2 100,207
47,974,287 372,496
Provision for impairment of financial assets 5.14 7,479,086
(133,704) 3,841,825
Net financial expenses 5.3 (1,372,862)
(7,041,490) 36,090,205
(Gain)/loss on PPE disposals (1,213,250) 287,613,797
(32,784,619) (50,010,523)
Increase/(decrease) in retirement benefits 5.21 187,518,681 (47,984,771)
(27,750,000) 189,618,503
Increase/(decrease) in provisions 5.22 (43,572,327)
116,196,354 (22,683,978)
Increase/(decrease) in other assets/liabilities 5,637,821
(4,450,763) 0
Increase/(decrease) in working capital 1,124,377 273,093
Cash generated from operations (201,094,607) (16,773,063)
289,062
Income tax paid 5.23 (75,000,000)
(204,131,931) (51,315,744)
Interest paid 5.3
(111,000,000) (33,842)
Net cash flow from operating activities (54,491,156) (126,349,586)
(7,551)
Investment activities 46,495,853
(165,498,707)
Acquisition of PPE 5.7, 5.8, 5.9 220,476,039
(253,434,285)
Interest received 5.3 266,971,892
266,971,892
Investments to held-to-maturity financial assets 5.10
13,537,607
Dividends received from associate
Net cash flow from investment activities
Financial activities
Dividends paid 5.19
Repayment of bank loans 5.20
Repayment of finance lease obligations
Net cash flow from financial activities
Net increase/(decrease) in cash &
cash equivalents
Cash & cash equivalents at
the beginning of the year
Cash & cash equivalents at
the end of the year
The notes on pages 19 to 52 are an integral part of these financial statements.
Financial Statements as at 31 December 2012 (Amounts in Euros unless otherwise stated) Page 18 of 54