Page 51 - 2board23full
P. 51
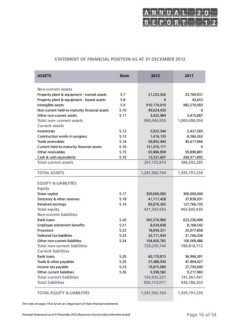
STATEMENT OF FINANCIAL POSITION AS AT 31 DECEMBER 2012
ASSETS Note 2012 2011
Non-current assets 21,223,526 23,769,031
0 43,653
Property plant & equipment - owned assets 5.7
916,170,010 982,270,583
Property plant & equipment - leased assets 5.8 49,624,430 0
3,422,984
Intangible assets 5.9 3,415,687
990,440,950 1,009,498,954
Non-current held-to-maturity financial assets 5.10
5,922,544 5,437,283
Other non-current assets 5.11 1,416,135 8,366,263
58,892,494 45,617,966
Total non- current assets 151,470,177
65,886,858 0
Current assets 13,537,607 59,898,881
297,125,814 266,971,892
Inventories 5.12 386,292,285
1,287,566,764
Construction works in progress 5.13 1,395,791,239
300,000,000
Trade receivables 5.14 41,717,428 300,000,000
89,676,265 37,838,931
Current held-to-maturity financial assets 5.10
431,393,693 127,766,105
Other receivables 5.15 465,605,036
565,376,960
Cash & cash equivalents 5.16 8,034,838 623,236,490
8,168,542
Total current assets 18,659,231
32,711,934 25,077,858
TOTAL ASSETS 104,456,782 31,766,336
729,239,744 100,569,486
EQUITY & LIABILITIES 788,818,712
60,170,815
Equity 37,488,930 56,996,381
19,875,000 47,404,027
Share capital 5.17 27,750,000
9,398,582
Statutory & other reserves 5.18 126,933,327 9,217,083
856,173,071 141,367,491
Retained earnings 5.19 930,186,203
1,287,566,764
Total equity 1,395,791,239
Non-current liabilities Page 16 of 54
Bank loans 5.20
Employee retirement benefits 5.21
Provisions 5.22
Deferred tax liabilities 5.23
Other non-current liabilities 5.24
Total non-current liabilities
Current liabilities
Bank loans 5.20
Trade & other payables 5.25
Income tax payable 5.23
Other current liabilities 5.26
Total current liabilities
Total liabilities
TOTAL EQUITY & LIABILITIES
The notes on pages 19 to 52 are an integral part of these financial statements.
Financial Statements as at 31 December 2012 (Amounts in Euros unless otherwise stated)