Page 75 - 2board23full
P. 75
FINANCIAL STATEMENTS
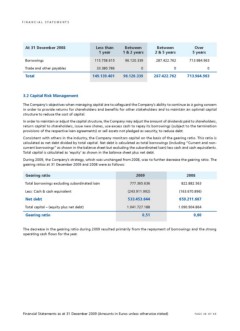
At 31 December 2008 Less than Between Between Over
1 year 1 & 2 years 2 & 5 years 5 years
287.422.762 713.984.963
Borrowings 115.758.615 96.120.339
Trade and other payables 33.380.786 0 0 0
Total 287.422.762 713.984.963
149.139.401 96.120.339
3.2 Capital Risk Management
The Company’s objectives when managing capital are to safeguard the Company’s ability to continue as a going concern
in order to provide returns for shareholders and benefits for other stakeholders and to maintain an optimal capital
structure to reduce the cost of capital.
In order to maintain or adjust the capital structure, the Company may adjust the amount of dividends paid to shareholders,
return capital to shareholders, issue new shares, use excess cash to repay its borrowings (subject to the termination
provisions of the respective loan agreements) or sell assets not pledged as security, to reduce debt.
Consistent with others in the industry, the Company monitors capital on the basis of the gearing ratio. This ratio is
calculated as net debt divided by total capital. Net debt is calculated as total borrowings (including “Current and non-
current borrowings” as shown in the balance sheet but excluding the subordinated loan) less cash and cash equivalents.
Total capital is calculated as ‘equity’ as shown in the balance sheet plus net debt.
During 2009, the Company’s strategy, which was unchanged from 2008, was to further decrease the gearing ratio. The
gearing ratios at 31 December 2009 and 2008 were as follows:
Gearing ratio 2009 2008
Total borrowings excluding subordinated loan 777.365.636 822.882.563
Less: Cash & cash equivalent (243.911.992) (163.670.896)
Net debt 533.453.644 659.211.667
Total capital – (equity plus net debt) 1.041.727.188 1.090.904.864
Gearing ratio
0,51 0,60
The decrease in the gearing ratio during 2009 resulted primarily from the repayment of borrowings and the strong
operating cash flows for the year.
Financial Statements as at 31 December 2009 (Amounts in Euros unless otherwise stated) PAGE 38 OF 69