Page 74 - 2board23full
P. 74
FINANCIAL STATEMENTS
The Company has a high concentration of credit risk with respect to 2 domestic carriers (2008: 2 domestic carriers) which
individually represent higher than 10% of its revenues.
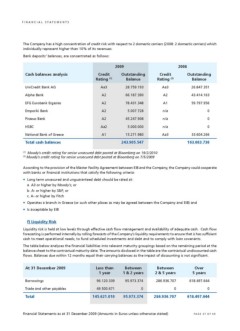
Bank deposits’ balances, are concentrated as follows:
2009 2008
Cash balances analysis Credit Outstanding Credit Outstanding
Rating (1) Balance Rating (2) Balance
UniCredit Bank AG Aa3 28.759.193 Aa3 26.847.351
Alpha Bank A2 66.187.390 A2 43.414.163
EFG Eurobank Ergasias A2 78.431.348 A1 59.797.956
Emporiki Bank A2 5.007.728 n/a 0
Piraeus Bank A2 45.247.908 n/a 0
HSBC Aa2 5.000.000 n/a 0
National Bank of Greece A1 15.271.980 Aa3 33.604.266
Total cash balances 243.905.547 163.663.736
(1) Moody’s credit rating for senior unsecured debt posted at Bloomberg on 19/2/2010
(2) Moody’s credit rating for senior unsecured debt posted at Bloomberg on 7/5/2009
According to the provision of the Master Facility Agreement between EIB and the Company, the Company could cooperate
with banks or financial institutions that satisfy the following criteria:
• Long term unsecured and unguaranteed debt should be rated at:
a. A3 or higher by Moody’s; or
b. A- or higher by S&P; or
c. A- or higher by Fitch
• Operates a branch in Greece (or such other places as may be agreed between the Company and EIB) and
• Is acceptable by EIB
f) Liquidity Risk
Liquidity risk is held at low levels through effective cash flow management and availability of adequate cash. Cash flow
forecasting is performed internally by rolling forecasts of the Company’s liquidity requirements to ensure that is has sufficient
cash to meet operational needs, to fund scheduled investments and debt and to comply with loan covenants.
The table below analyses the financial liabilities into relevant maturity groupings based on the remaining period at the
balance sheet to the contractual maturity date. The amounts disclosed in the table are the contractual undiscounted cash
flows. Balances due within 12 months equal their carrying balances as the impact of discounting is not significant.
At 31 December 2009 Less than Between Between Over
1 year 1 & 2 years 2 & 5 years 5 years
286.936.707 618.497.644
Borrowings 96.120.339 95.973.374
Trade and other payables 49.500.671 0 0 0
Total 145.621.010 286.936.707 618.497.644
95.973.374
Financial Statements as at 31 December 2009 (Amounts in Euros unless otherwise stated) PAGE 37 OF 69
The Company has a high concentration of credit risk with respect to 2 domestic carriers (2008: 2 domestic carriers) which
individually represent higher than 10% of its revenues.
Bank deposits’ balances, are concentrated as follows:
2009 2008
Cash balances analysis Credit Outstanding Credit Outstanding
Rating (1) Balance Rating (2) Balance
UniCredit Bank AG Aa3 28.759.193 Aa3 26.847.351
Alpha Bank A2 66.187.390 A2 43.414.163
EFG Eurobank Ergasias A2 78.431.348 A1 59.797.956
Emporiki Bank A2 5.007.728 n/a 0
Piraeus Bank A2 45.247.908 n/a 0
HSBC Aa2 5.000.000 n/a 0
National Bank of Greece A1 15.271.980 Aa3 33.604.266
Total cash balances 243.905.547 163.663.736
(1) Moody’s credit rating for senior unsecured debt posted at Bloomberg on 19/2/2010
(2) Moody’s credit rating for senior unsecured debt posted at Bloomberg on 7/5/2009
According to the provision of the Master Facility Agreement between EIB and the Company, the Company could cooperate
with banks or financial institutions that satisfy the following criteria:
• Long term unsecured and unguaranteed debt should be rated at:
a. A3 or higher by Moody’s; or
b. A- or higher by S&P; or
c. A- or higher by Fitch
• Operates a branch in Greece (or such other places as may be agreed between the Company and EIB) and
• Is acceptable by EIB
f) Liquidity Risk
Liquidity risk is held at low levels through effective cash flow management and availability of adequate cash. Cash flow
forecasting is performed internally by rolling forecasts of the Company’s liquidity requirements to ensure that is has sufficient
cash to meet operational needs, to fund scheduled investments and debt and to comply with loan covenants.
The table below analyses the financial liabilities into relevant maturity groupings based on the remaining period at the
balance sheet to the contractual maturity date. The amounts disclosed in the table are the contractual undiscounted cash
flows. Balances due within 12 months equal their carrying balances as the impact of discounting is not significant.
At 31 December 2009 Less than Between Between Over
1 year 1 & 2 years 2 & 5 years 5 years
286.936.707 618.497.644
Borrowings 96.120.339 95.973.374
Trade and other payables 49.500.671 0 0 0
Total 145.621.010 286.936.707 618.497.644
95.973.374
Financial Statements as at 31 December 2009 (Amounts in Euros unless otherwise stated) PAGE 37 OF 69