Page 77 - 2board23full
P. 77
34-35
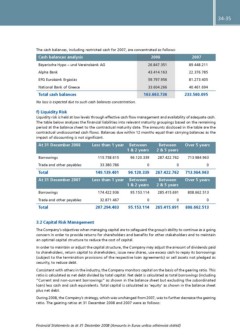
The cash balances, including restricted cash for 2007, are concentrated as follows:
Cash balances analysis 2008 2007
89.448.211
Bayerische Hypo – und Vereinsbank AG 26.847.351 22.376.785
81.273.405
Alpha Bank 43.414.163 40.461.694
233.560.095
EFG Eurobank Ergasias 59.797.956
National Bank of Greece 33.604.266
Total cash balances 163.663.736
No loss is expected due to such cash balances concentration.
f) Liquidity Risk
Liquidity risk is held at low levels through effective cash flow management and availability of adequate cash.
The table below analyses the financial liabilities into relevant maturity groupings based on the remaining
period at the balance sheet to the contractual maturity date. The amounts disclosed in the table are the
contractual undiscounted cash flows. Balances due within 12 months equal their carrying balances as the
impact of discounting is not significant.
At 31 December 2008 Less than 1 year Between Between Over 5 years
1 & 2 years 2 & 5 years
Borrowings 115.758.615 96.120.339 287.422.762 713.984.963
Trade and other payables 33.380.786 0 0 0
Total 149.139.401 96.120.339 287.422.762 713.984.963
At 31 December 2007 Less than 1 year Between Between Over 5 years
1 & 2 years 2 & 5 years
Borrowings 174.422.936 95.153.114 285.415.691 808.662.513
Trade and other payables 32.871.467 0 0 0
Total 207.294.403 95.153.114 285.415.691 808.662.513
3.2 Capital Risk Management
The Company’s objectives when managing capital are to safeguard the group’s ability to continue as a going
concern in order to provide returns for shareholders and benefits for other stakeholders and to maintain
an optimal capital structure to reduce the cost of capital.
In order to maintain or adjust the capital structure, the Company may adjust the amount of dividends paid
to shareholders, return capital to shareholders, issue new shares, use excess cash to repay its borrowings
(subject to the termination provisions of the respective loan agreements) or sell assets not pledged as
security, to reduce debt.
Consistent with others in the industry, the Company monitors capital on the basis of the gearing ratio. This
ratio is calculated as net debt divided by total capital. Net debt is calculated as total borrowings (including
“Current and non-current borrowings” as shown in the balance sheet but excluding the subordinated
loan) less cash and cash equivalents. Total capital is calculated as ‘equity’ as shown in the balance sheet
plus net debt.
During 2008, the Company’s strategy, which was unchanged from 2007, was to further decrease the gearing
ratio. The gearing ratios at 31 December 2008 and 2007 were as follows:
Financial Statements as at 31 December 2008 (Amounts in Euros unless otherwise stated)