Page 83 - Annual_Report_2016
P. 83
aia.gr Annual Report 2016
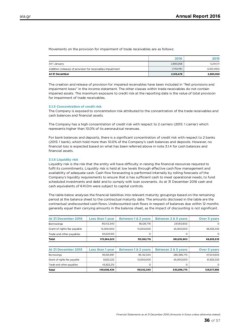
Movements on the provision for impairment of trade receivables are as follows:
At 1 January 2016 2015
Addition (release) of provision for receivables impairment
At 31 December 2,693,058 5,244,111
(179,579) (2,551,053)
2,513,479 2,693,058
The creation and release of provision for impaired receivables have been included in “Net provisions and
impairment loses” in the income statement. The other classes within trade receivables do not contain
impaired assets. The maximum exposure to credit risk at the reporting date is the value of total provision
for impairment of trade receivables.
3.1.5 Concentration of credit risk
The Company is exposed to concentration risk attributed to the concentration of the trade receivables and
cash balances and financial assets.
The Company has a high concentration of credit risk with respect to 2 carriers (2015: 1 carrier) which
represents higher than 10.0% of its aeronautical revenues.
For bank balances and deposits, there is a significant concentration of credit risk with respect to 2 banks
(2015: 1 bank), which hold more than 10.0% of the Company’s cash balances and deposits. However, no
financial loss is expected based on what has been referred above in note 3.1.4 for cash balances and
financial assets.
3.1.6 Liquidity risk
Liquidity risk is the risk that the entity will have difficulty in raising the financial resources required to
fulfil its commitments. Liquidity risk is held at low levels through effective cash flow management and
availability of adequate cash. Cash flow forecasting is performed internally by rolling forecasts of the
Company’s liquidity requirements to ensure that is has sufficient cash to meet operational needs, to fund
scheduled investments and debt and to comply with loan covenants. As at 31 December 2016 cash and
cash equivalents of €41.0m were subject to capital controls.
The table below analyses the financial liabilities into relevant maturity groupings based on the remaining
period at the balance sheet to the contractual maturity date. The amounts disclosed in the table are the
contractual undiscounted cash flows. Undiscounted cash flows in respect of balances due within 12 months
generally equal their carrying amounts in the balance sheet, as the impact of discounting is not significant.
At 31 December 2016 Less than 1 year Between 1 & 2 years Between 2 & 5 years Over 5 years
Borrowings 95,142,340 95,128,776 237,812,602 0
Grant of rights fee payable 15,000,000 15,000,000 45,000,000 66,833,333
Trade and other payables
Total 60,222,183 0 0 0
170,364,523 110,128,776 282,812,602 66,833,333
At 31 December 2015 Less than 1 year Between 1 & 2 years Between 2 & 5 years Over 5 years
Borrowings 95,163,997 95,142,340 285,396,775 47,544,603
Grant of rights fee payable 8,622,222 15,000,000 45,000,000 81,833,333
Trade and other payables 45,822,215
Total 149,608,434 0 0 0
110,142,340 330,396,775 129,377,936
Financial Statements as at 31 December 2016 (Amounts in Euros unless otherwise stated)
36 of 57