Page 7 - Ath Airport Profile
P. 7
5
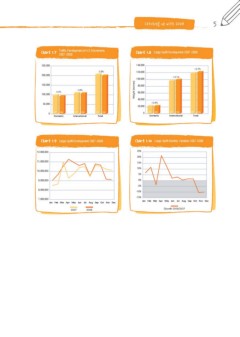
Chart 1.7 Traffic Development of A/C Movements Chart 1.8 Cargo Uplift Development 2007-2008
2007-2008
250,000 140,000
-2.9% +2.7%
07 08 120,000
200,000 Total +3.1%
100,000
150,000 Weight (tonnes) 80,000
100,000
-4.0% -1.8% 60,000
50,000 07 08 40,000 +0.8%
20,000
0 07 08 International
0 07 08 07 08 07 08
Domestic
Domestic International Total
Chart 1.9 Cargo Uplift Development 2007-2008 Chart 1.10 Cargo Uplift Monthly Variation 2007-2008
12,000,000 25%
20%
11,000,000 15%
10%
10,000,000 5%
0%
9,000,000 -5%
-10%
8,000,000 -15%
7,000,000 Jan Feb Mar Apr May Jun Jul Aug Sep Oct Nov Dec
Jan Feb Mar Apr May Jun Jul Aug Sep Oct Nov Dec
Growth 2008/2007
2007 2008