Page 54 - 2board23full
P. 54
FINANCIAL STATEMENTS
CHAPTER 6
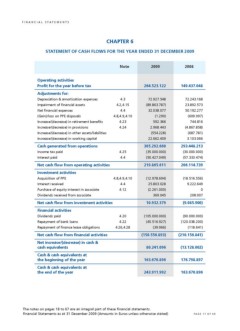
STATEMENT OF CASH FLOWS FOR THE YEAR ENDED 31 DECEMBER 2009
Note 2009 2008
Operating activities 149.437.048
Profit for the year before tax 264.523.122 72.243.168
23.892.573
Adjustments for: 72.927.548 50.192.277
(89.863.787)
Depreciation & amortisation expenses 4.3 (609.097)
32.038.077 744.816
Impairment of financial assets 4.2,4.15 (1.290)
(4.867.858)
Net financial expenses 4.4 592.366 (687.781)
2.968.443 3.103.066
(Gain)/loss on PPE disposals 4.8,4.9,4.10 (554.228)
22.662.409 293.448.213
Increase/(decrease) in retirement benefits 4.23 305.292.660 (30.000.000)
(35.000.000) (57.333.474)
Increase/(decrease) in provisions 4.24 (50.427.049) 206.114.739
219.865.611
Increase/(decrease) in other assets/liabilities (18.516.556)
(12.978.694) 9.222.649
Increase/(decrease) in working capital 25.803.028 0
(2.261.000) 208.007
Cash generated from operations 369.045
(9.085.900)
Income tax paid 4.25 10.932.379
(90.000.000)
Interest paid 4.4 (105.000.000) (120.038.200)
(45.516.927)
Net cash flow from operating activities (39.966) (118.641)
(210.156.841)
Investment activities (150.556.893)
(13.128.002)
Acquisition of PPE 4.8,4.9,4.10 80.241.096
176.798.897
Interest received 4.4 163.670.896
163.670.896
Purchase of equity interest in associate 4.12 243.911.992
Dividends received from associate
Net cash flow from investment activities
Financial activities
Dividends paid 4.20
Repayment of bank loans 4.22
Repayment of finance lease obligations 4.26,4.28
Net cash flow from financial activities
Net increase/(decrease) in cash &
cash equivalents
Cash & cash equivalents at
the beginning of the year
Cash & cash equivalents at
the end of the year
The notes on pages 18 to 67 are an integral part of these financial statements. PAGE 17 OF 69
Financial Statements as at 31 December 2009 (Amounts in Euros unless otherwise stated)
CHAPTER 6
STATEMENT OF CASH FLOWS FOR THE YEAR ENDED 31 DECEMBER 2009
Note 2009 2008
Operating activities 149.437.048
Profit for the year before tax 264.523.122 72.243.168
23.892.573
Adjustments for: 72.927.548 50.192.277
(89.863.787)
Depreciation & amortisation expenses 4.3 (609.097)
32.038.077 744.816
Impairment of financial assets 4.2,4.15 (1.290)
(4.867.858)
Net financial expenses 4.4 592.366 (687.781)
2.968.443 3.103.066
(Gain)/loss on PPE disposals 4.8,4.9,4.10 (554.228)
22.662.409 293.448.213
Increase/(decrease) in retirement benefits 4.23 305.292.660 (30.000.000)
(35.000.000) (57.333.474)
Increase/(decrease) in provisions 4.24 (50.427.049) 206.114.739
219.865.611
Increase/(decrease) in other assets/liabilities (18.516.556)
(12.978.694) 9.222.649
Increase/(decrease) in working capital 25.803.028 0
(2.261.000) 208.007
Cash generated from operations 369.045
(9.085.900)
Income tax paid 4.25 10.932.379
(90.000.000)
Interest paid 4.4 (105.000.000) (120.038.200)
(45.516.927)
Net cash flow from operating activities (39.966) (118.641)
(210.156.841)
Investment activities (150.556.893)
(13.128.002)
Acquisition of PPE 4.8,4.9,4.10 80.241.096
176.798.897
Interest received 4.4 163.670.896
163.670.896
Purchase of equity interest in associate 4.12 243.911.992
Dividends received from associate
Net cash flow from investment activities
Financial activities
Dividends paid 4.20
Repayment of bank loans 4.22
Repayment of finance lease obligations 4.26,4.28
Net cash flow from financial activities
Net increase/(decrease) in cash &
cash equivalents
Cash & cash equivalents at
the beginning of the year
Cash & cash equivalents at
the end of the year
The notes on pages 18 to 67 are an integral part of these financial statements. PAGE 17 OF 69
Financial Statements as at 31 December 2009 (Amounts in Euros unless otherwise stated)